
Bullish Pennant Forms For Travere Therapeutics (TVTX)
Share

Travere Therapeutics, Inc. is a biopharmaceutical company. It engages in the identification, development, commercialization, and distribution of therapies to people living with rare diseases. The firm’s products include Chenodal, Cholbam, and Thiola.
Take a look at the 1-year chart of Travere (NASDAQ: TVTX) below with the added notations:
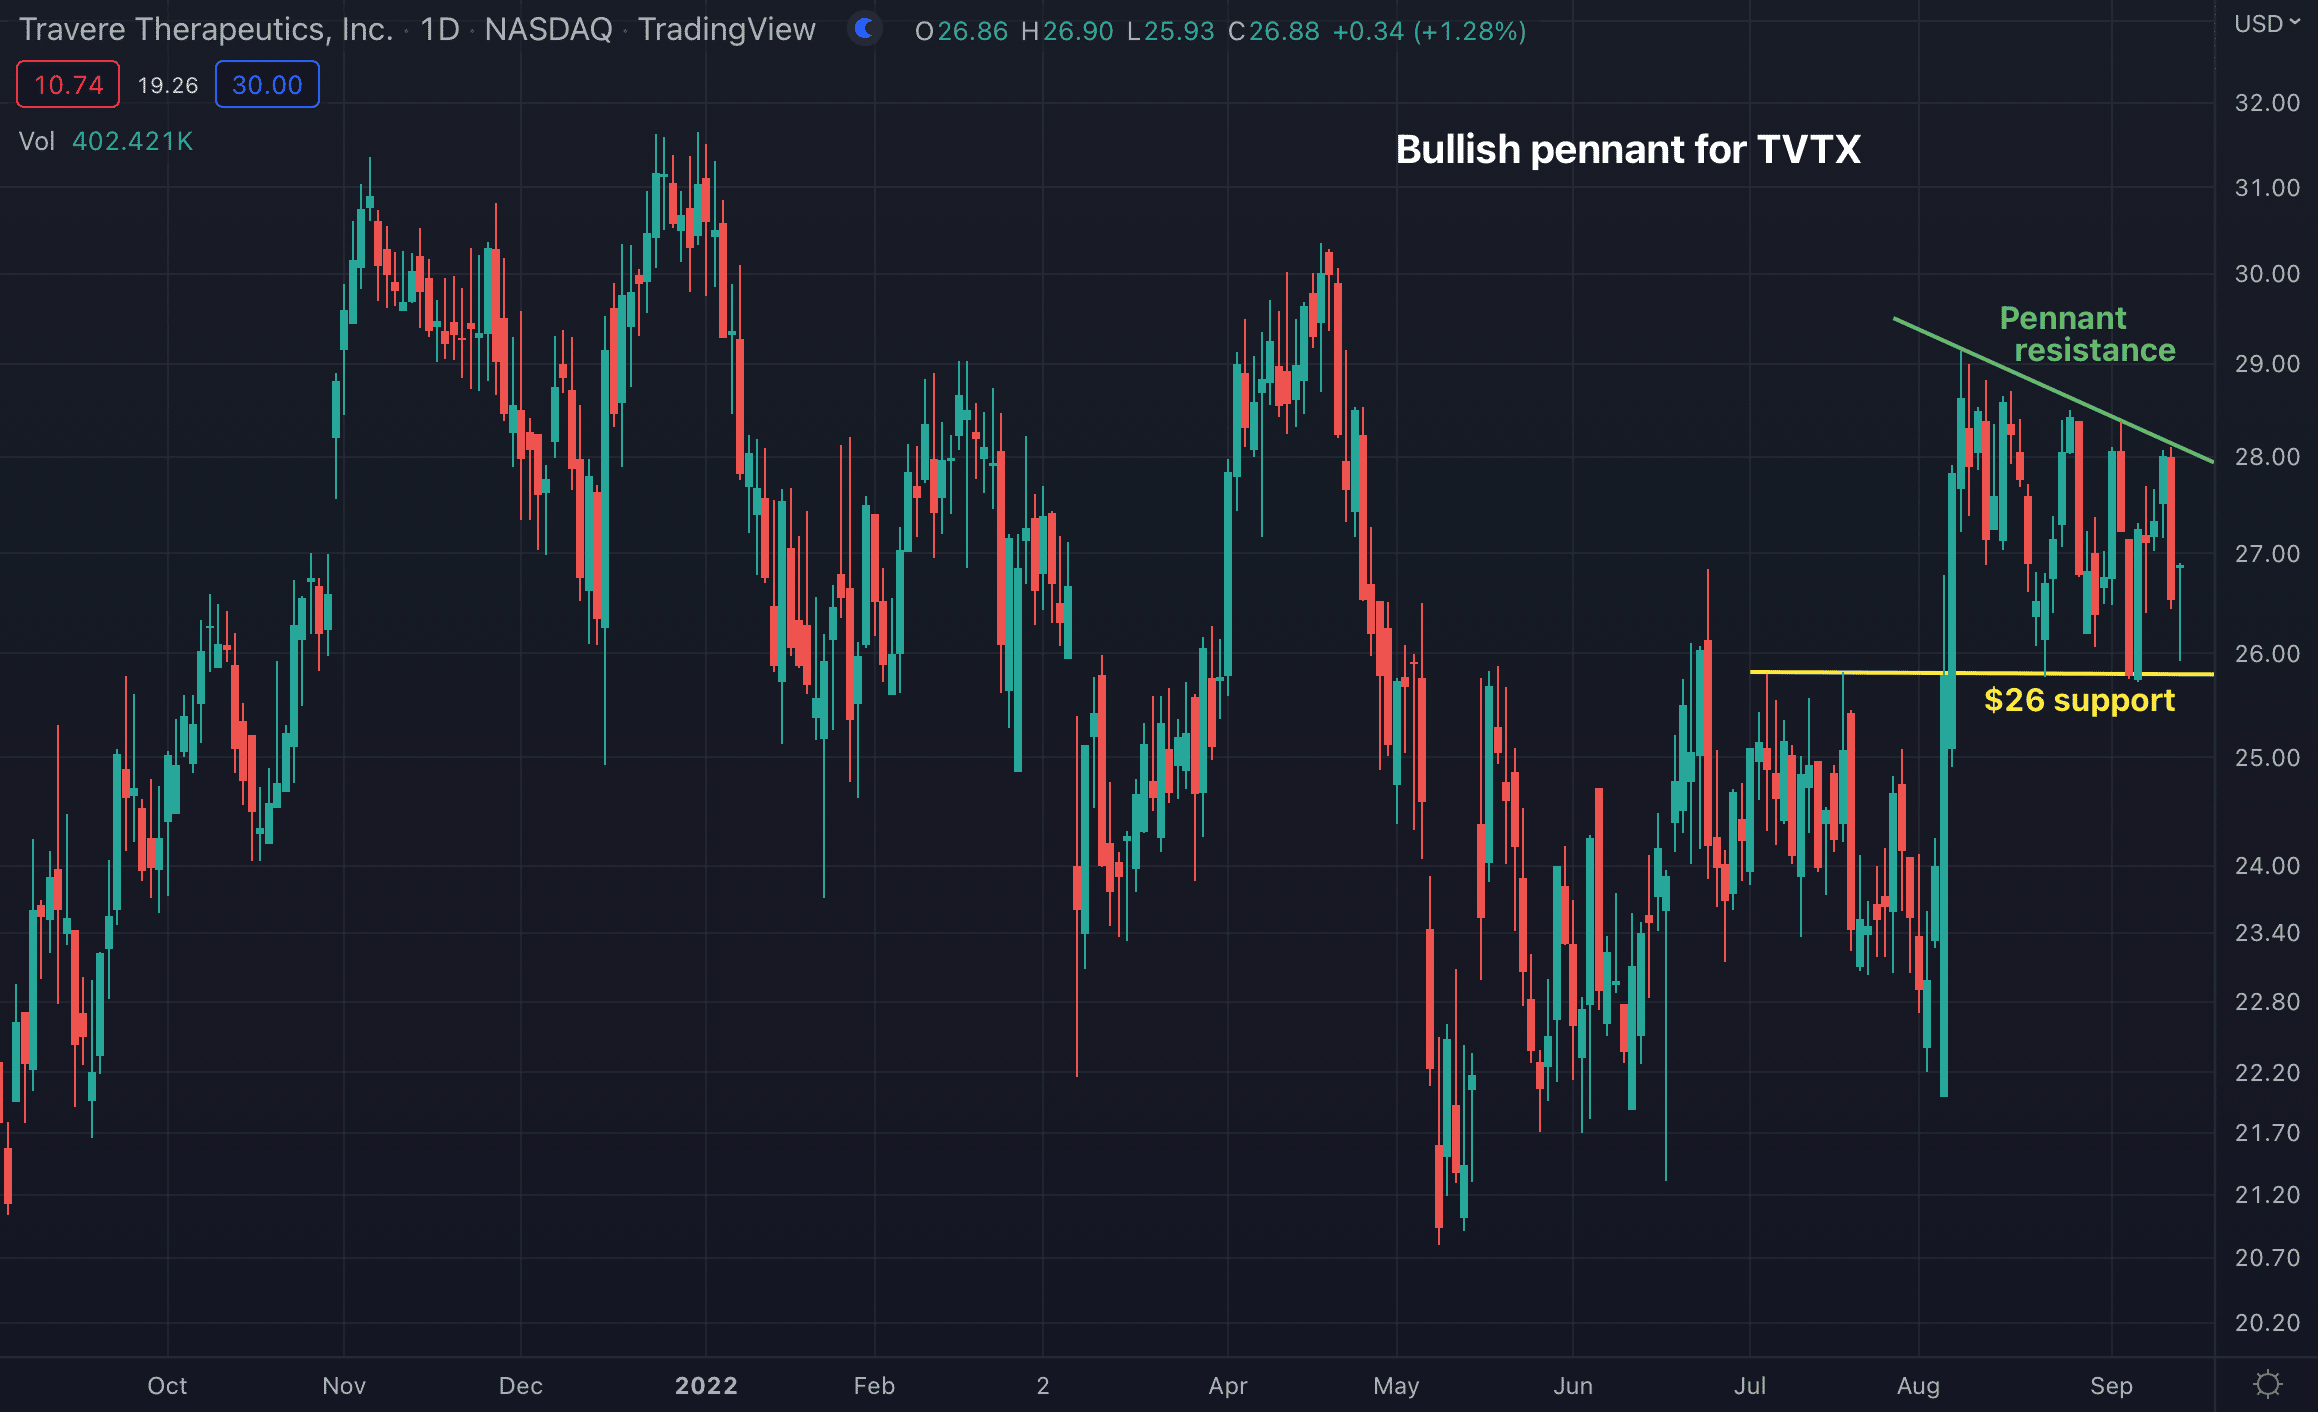
TVTX had fallen sharply in the spring before moving into a sideways chop. After that, the stock shot higher in August and has since been consolidating within a bullish pennant pattern. The pennant’s trendline resistance (green) and $26 support (yellow) can be seen on the chart below. A break through the topside of the pennant could mean a test of the 2022 high.
The Tale of the Tape: TVTX is consolidating within a pennant pattern. A break above $28 area should lead to higher prices, thus a long trade could be made.
Before making any trading decision, decide which side of the trade you believe gives you the highest probability of success. Do you prefer the short side of the market, long side, or do you want to be in the market at all? If you haven’t thought about it, review the overall indices themselves. For example, take a look at the S&P 500. Is it trending higher or lower? Has it recently broken through a key resistance or support level? Making these decisions ahead of time will help you decide which side of the trade you believe gives you the best opportunities.
No matter what your strategy or when you decide to enter, always remember to use protective stops and you’ll be around for the next trade. Capital preservation is always key…
Good luck!
Christian Tharp, CMT