
Did Deere & Co. (DE) Just Top?
Share

Deere & Co. engages in the manufacture and distribution of equipment used in agriculture, construction, forestry and turf care. It operates through the following segments: Agriculture and Turf, Construction and Forestry and Financial Services.
Take a look at the 6-month chart of Deere (DE) below with the added notations:
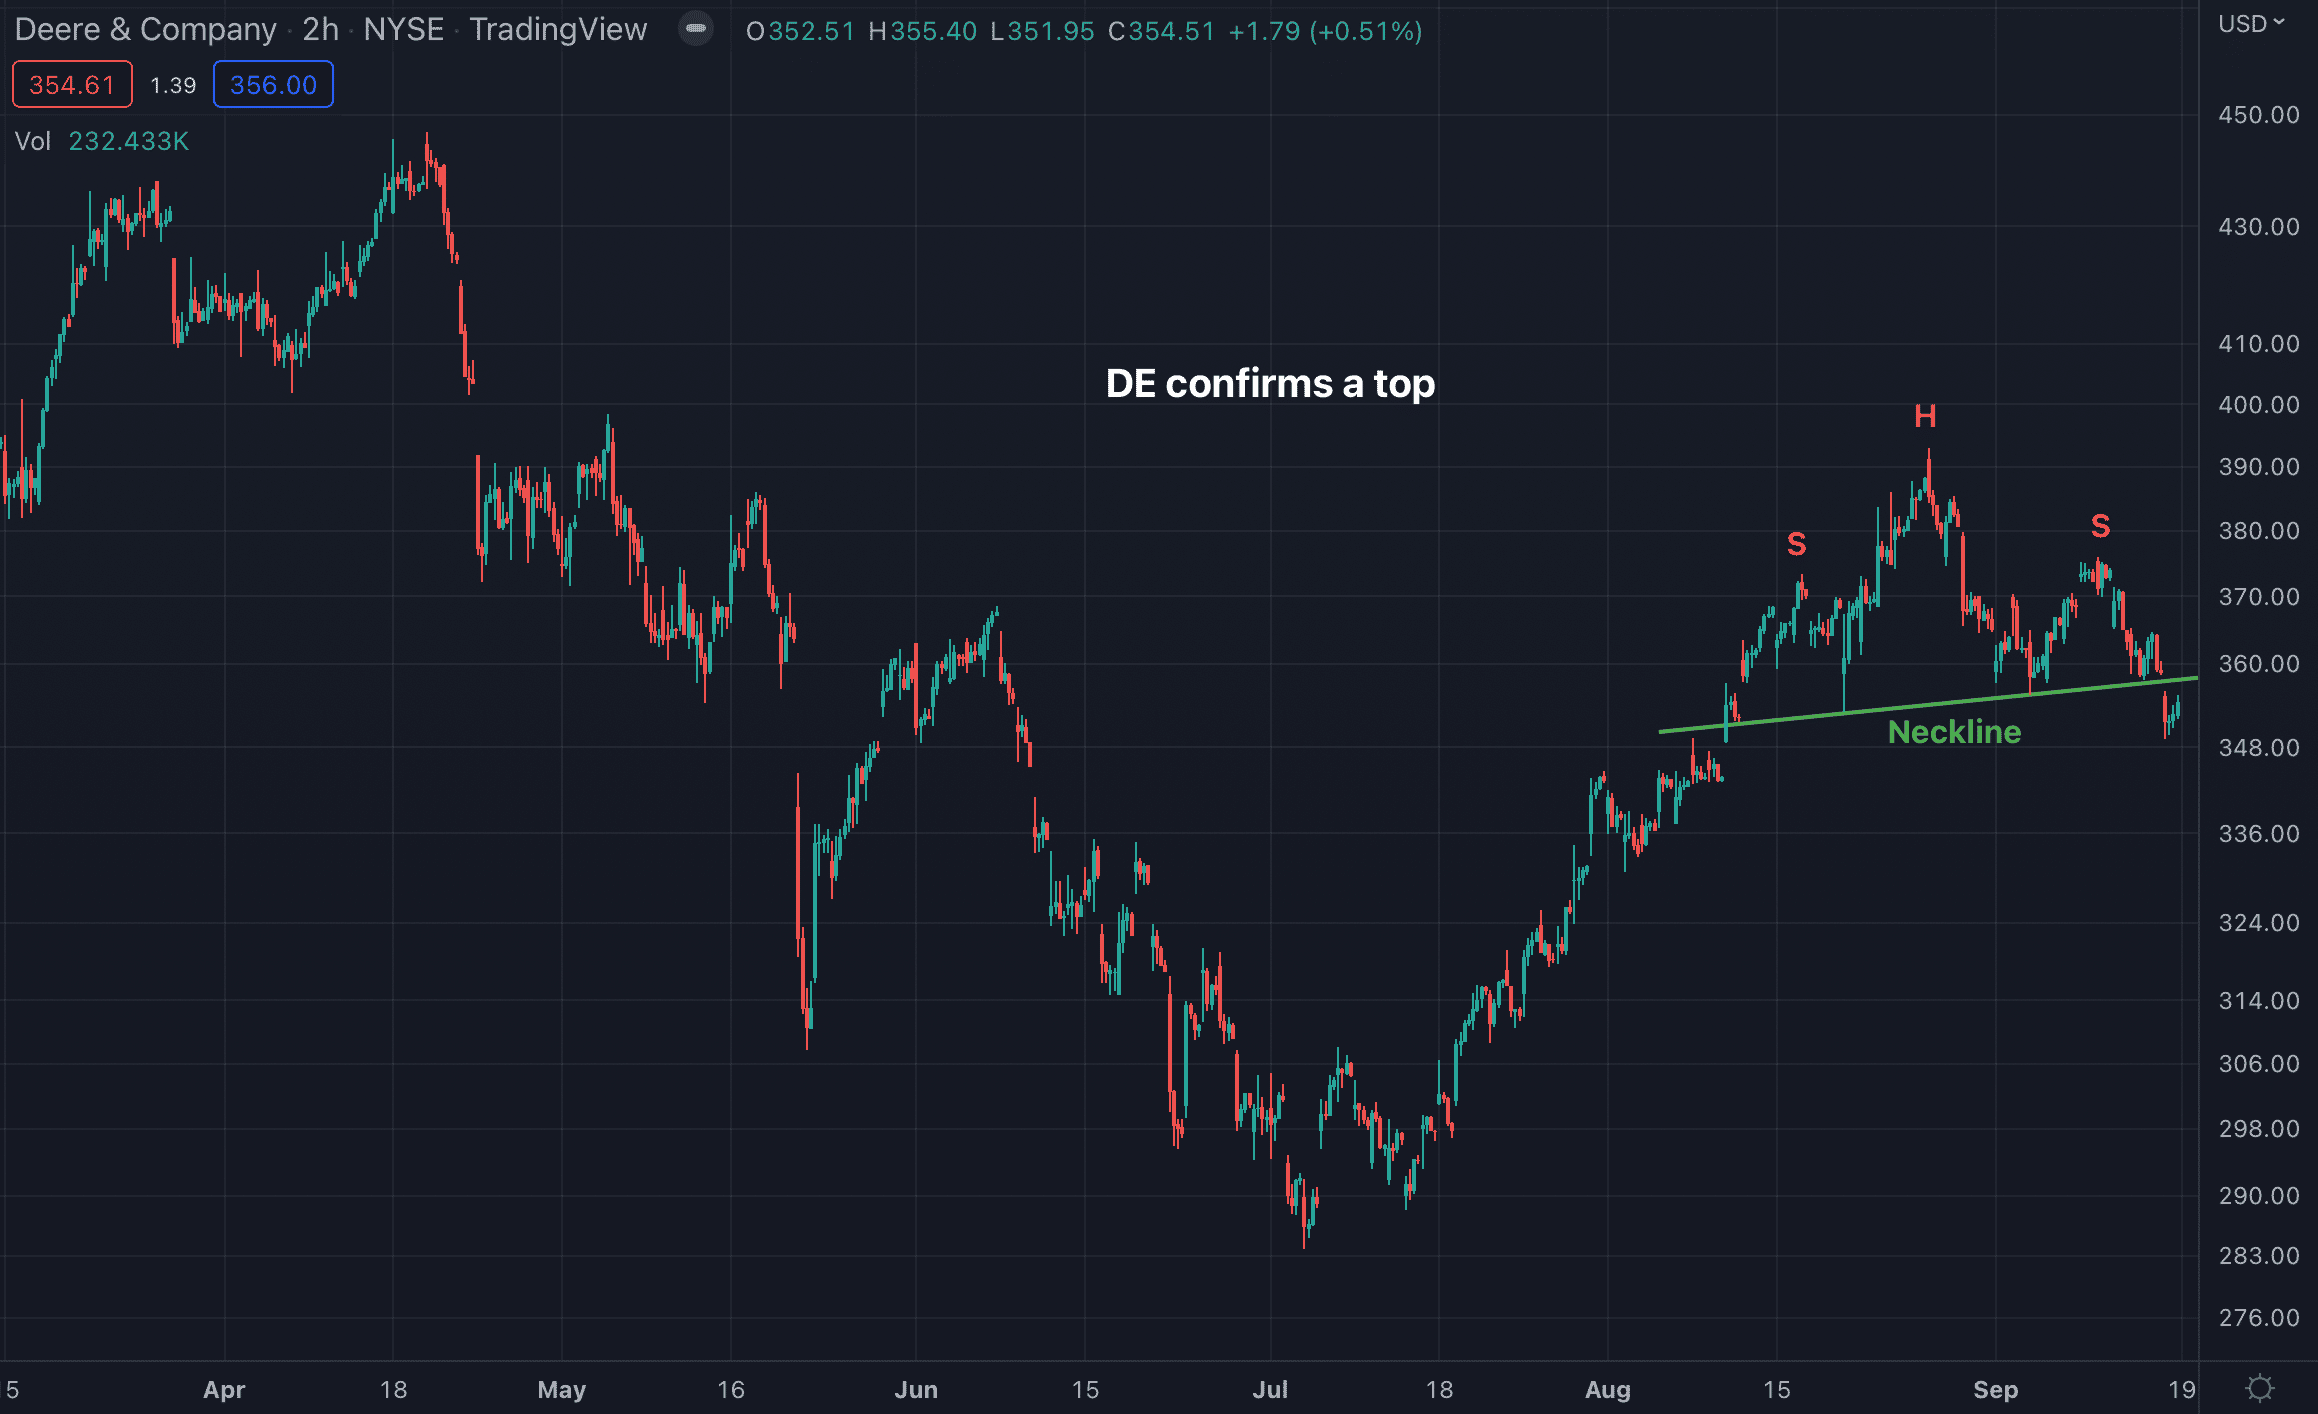
Chart of DE provided by TradingView
Over the past several weeks, DE has created a trendline of support (yellow), which is also the “neckline” for the stock’s bearish head and shoulders (H&S) topping pattern. Above the neckline you can see the H&S pattern (red) has been completed.
Confirmation of the H&S would occur if DE were to break the support, and that is exactly what the stock did last week.
The Tale of the Tape: DE has confirmed a head & shoulders pattern. A short trade could be made on a rally up to the neckline, with a protective stop set above that level.
Before making any trading decision, decide which side of the trade you believe gives you the highest probability of success. Do you prefer the short side of the market, long side, or do you want to be in the market at all? If you haven’t thought about it, review the overall indices themselves. For example, take a look at the S&P 500. Is it trending higher or lower? Has it recently broken through a key resistance or support level? Making these decisions ahead of time will help you decide which side of the trade you believe gives you the best opportunities.
No matter what your strategy or when you decide to enter, always remember to use protective stops and you’ll be around for the next trade. Capital preservation is always key…
Good luck!
Christian Tharp, CMT