
Discover Financial Services (DFS) Bounces Off Solid Support Level
Share

Discover Financial Services is a holding company, which engages in the provision of direct banking and payment services. It operates through the Direct Banking and Payment Services segments.
Take a look at the 1-year chart of Discover (DFS) below with the added notations:
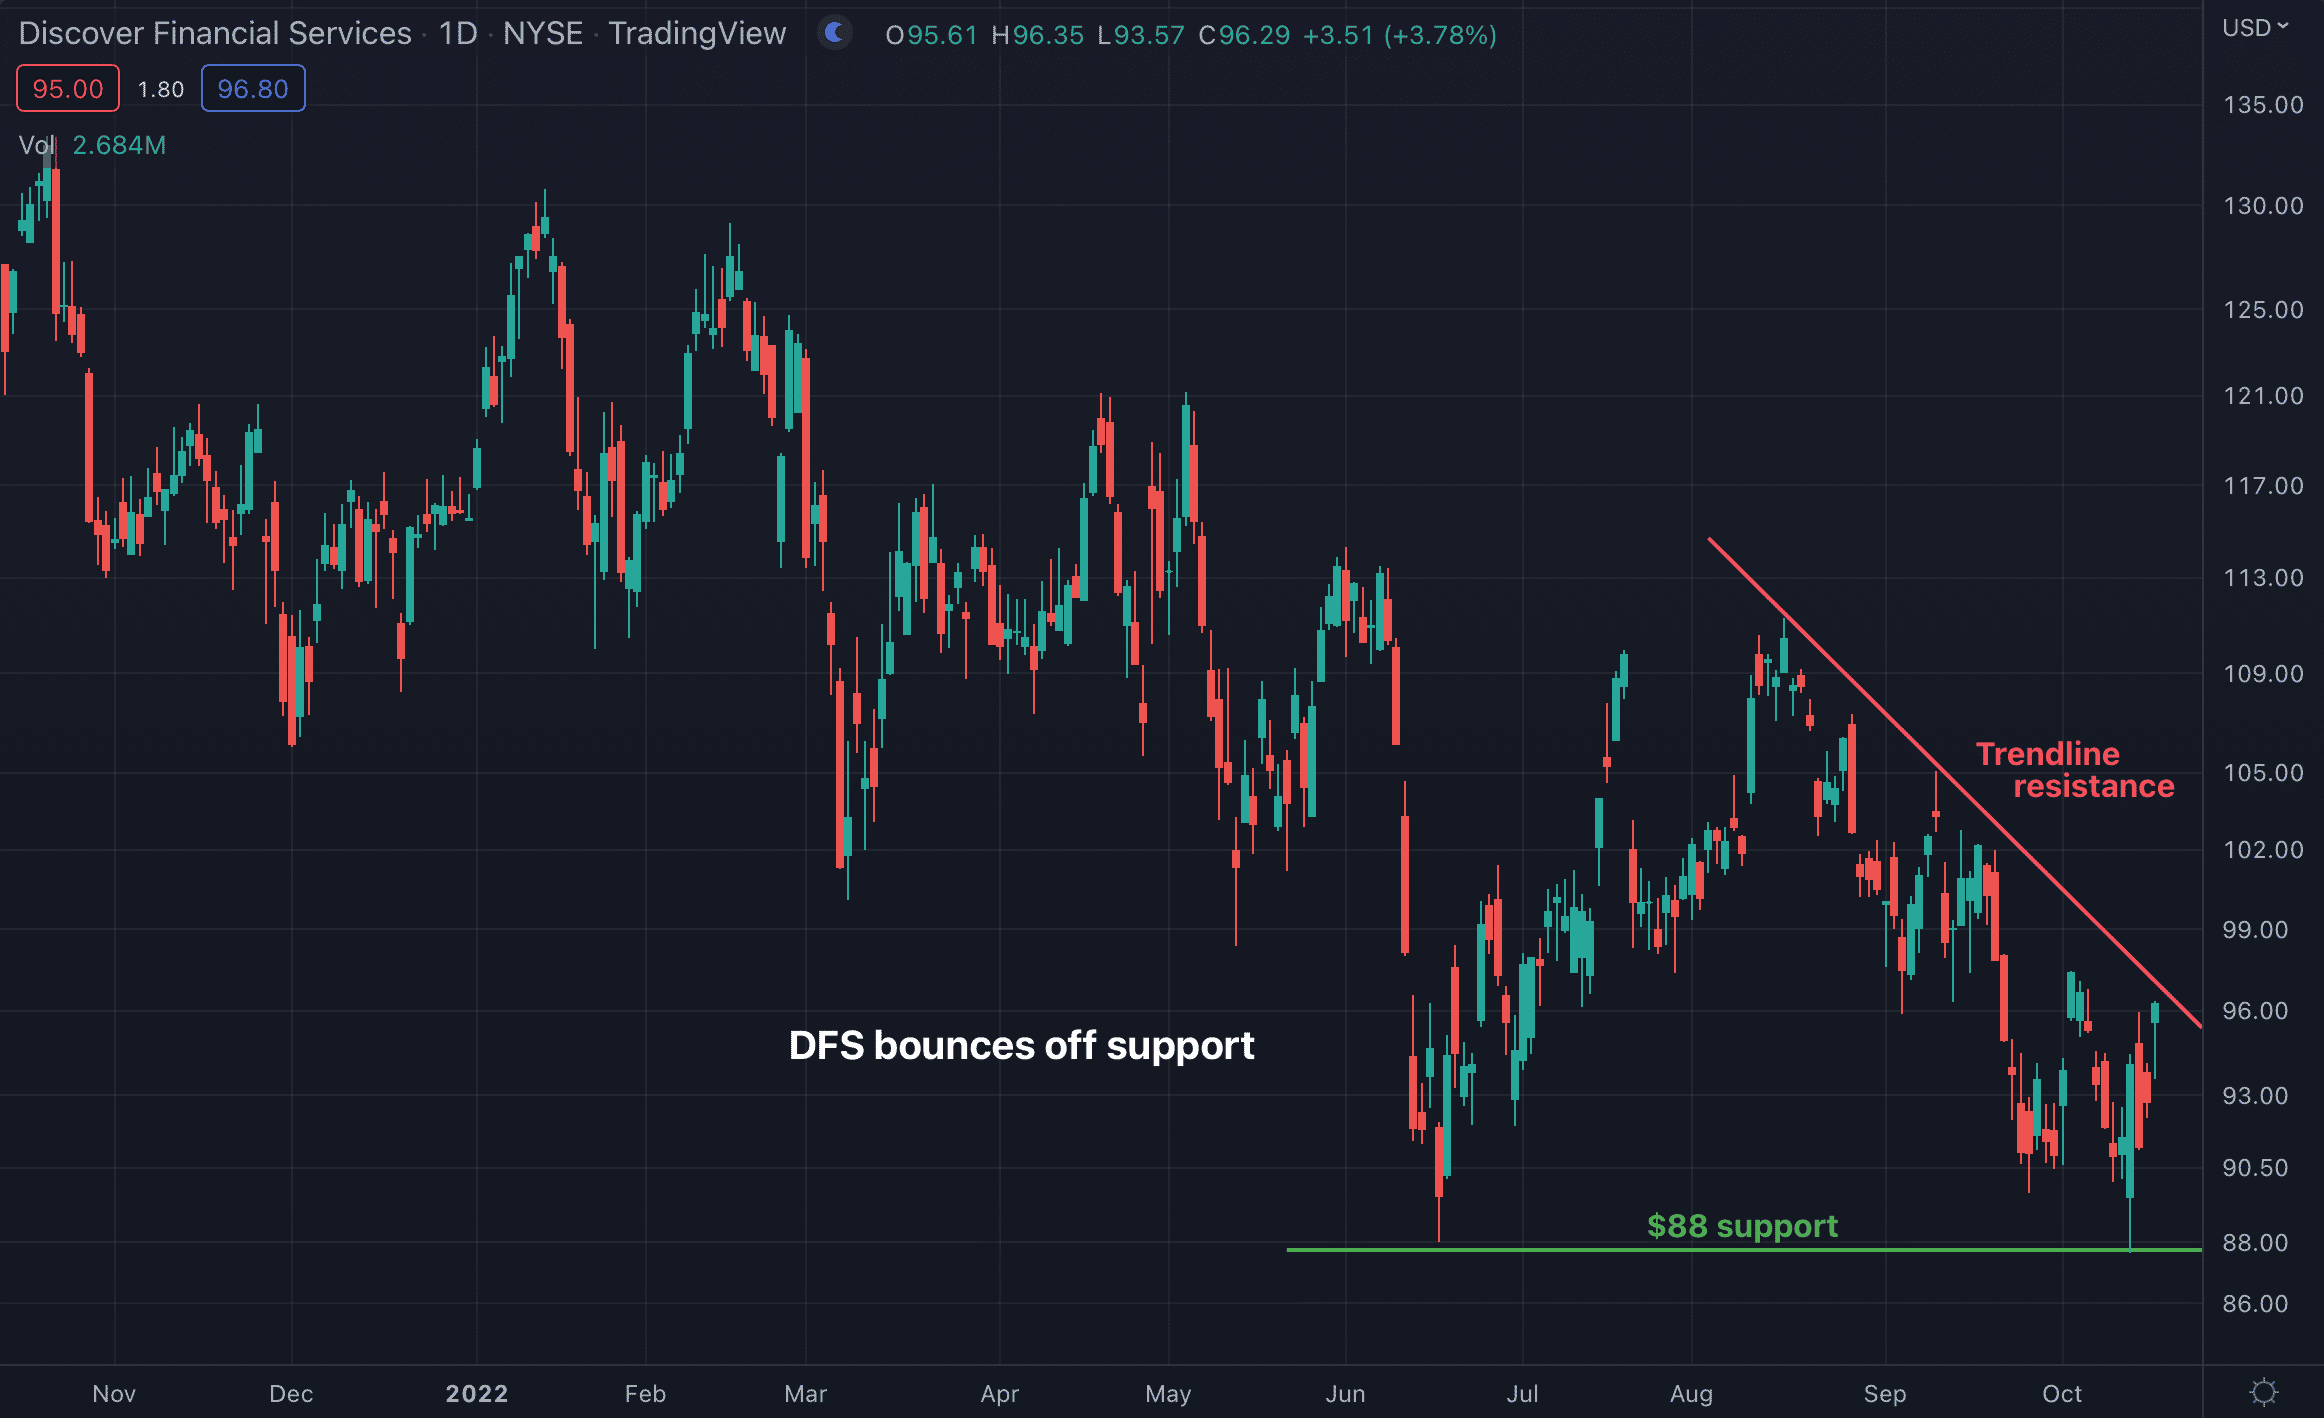
Over the past few months, DFS has been declining against a trendline of resistance (red), while also creating an important support level at $88 (green). At some point, DFS will have to break one of those two lines, and that break could dictate the next major move for the stock.
The Tale of the Tape: DFS is trading between key support and trendline resistance. A break of support could be an opportunity to get short, while a break of resistance might give traders a chance to get long.
Before making any trading decision, decide which side of the trade you believe gives you the highest probability of success. Do you prefer the short side of the market, long side, or do you want to be in the market at all? If you haven’t thought about it, review the overall indices themselves. For example, take a look at the S&P 500. Is it trending higher or lower? Has it recently broken through a key resistance or support level? Making these decisions ahead of time will help you decide which side of the trade you believe gives you the best opportunities.
No matter what your strategy or when you decide to enter, always remember to use protective stops and you’ll be around for the next trade. Capital preservation is always key…
Good luck!
Christian Tharp, CMT