
Is (XPRO) Ready For Takeoff?
Share

Expro Group Holdings NV engages in the provision of energy services. Its products and services include well construction, well flow management, well intervention and integrity, and subsea well access.
Take a look at the 1-year chart of Expro (XPRO) below with the added notations:
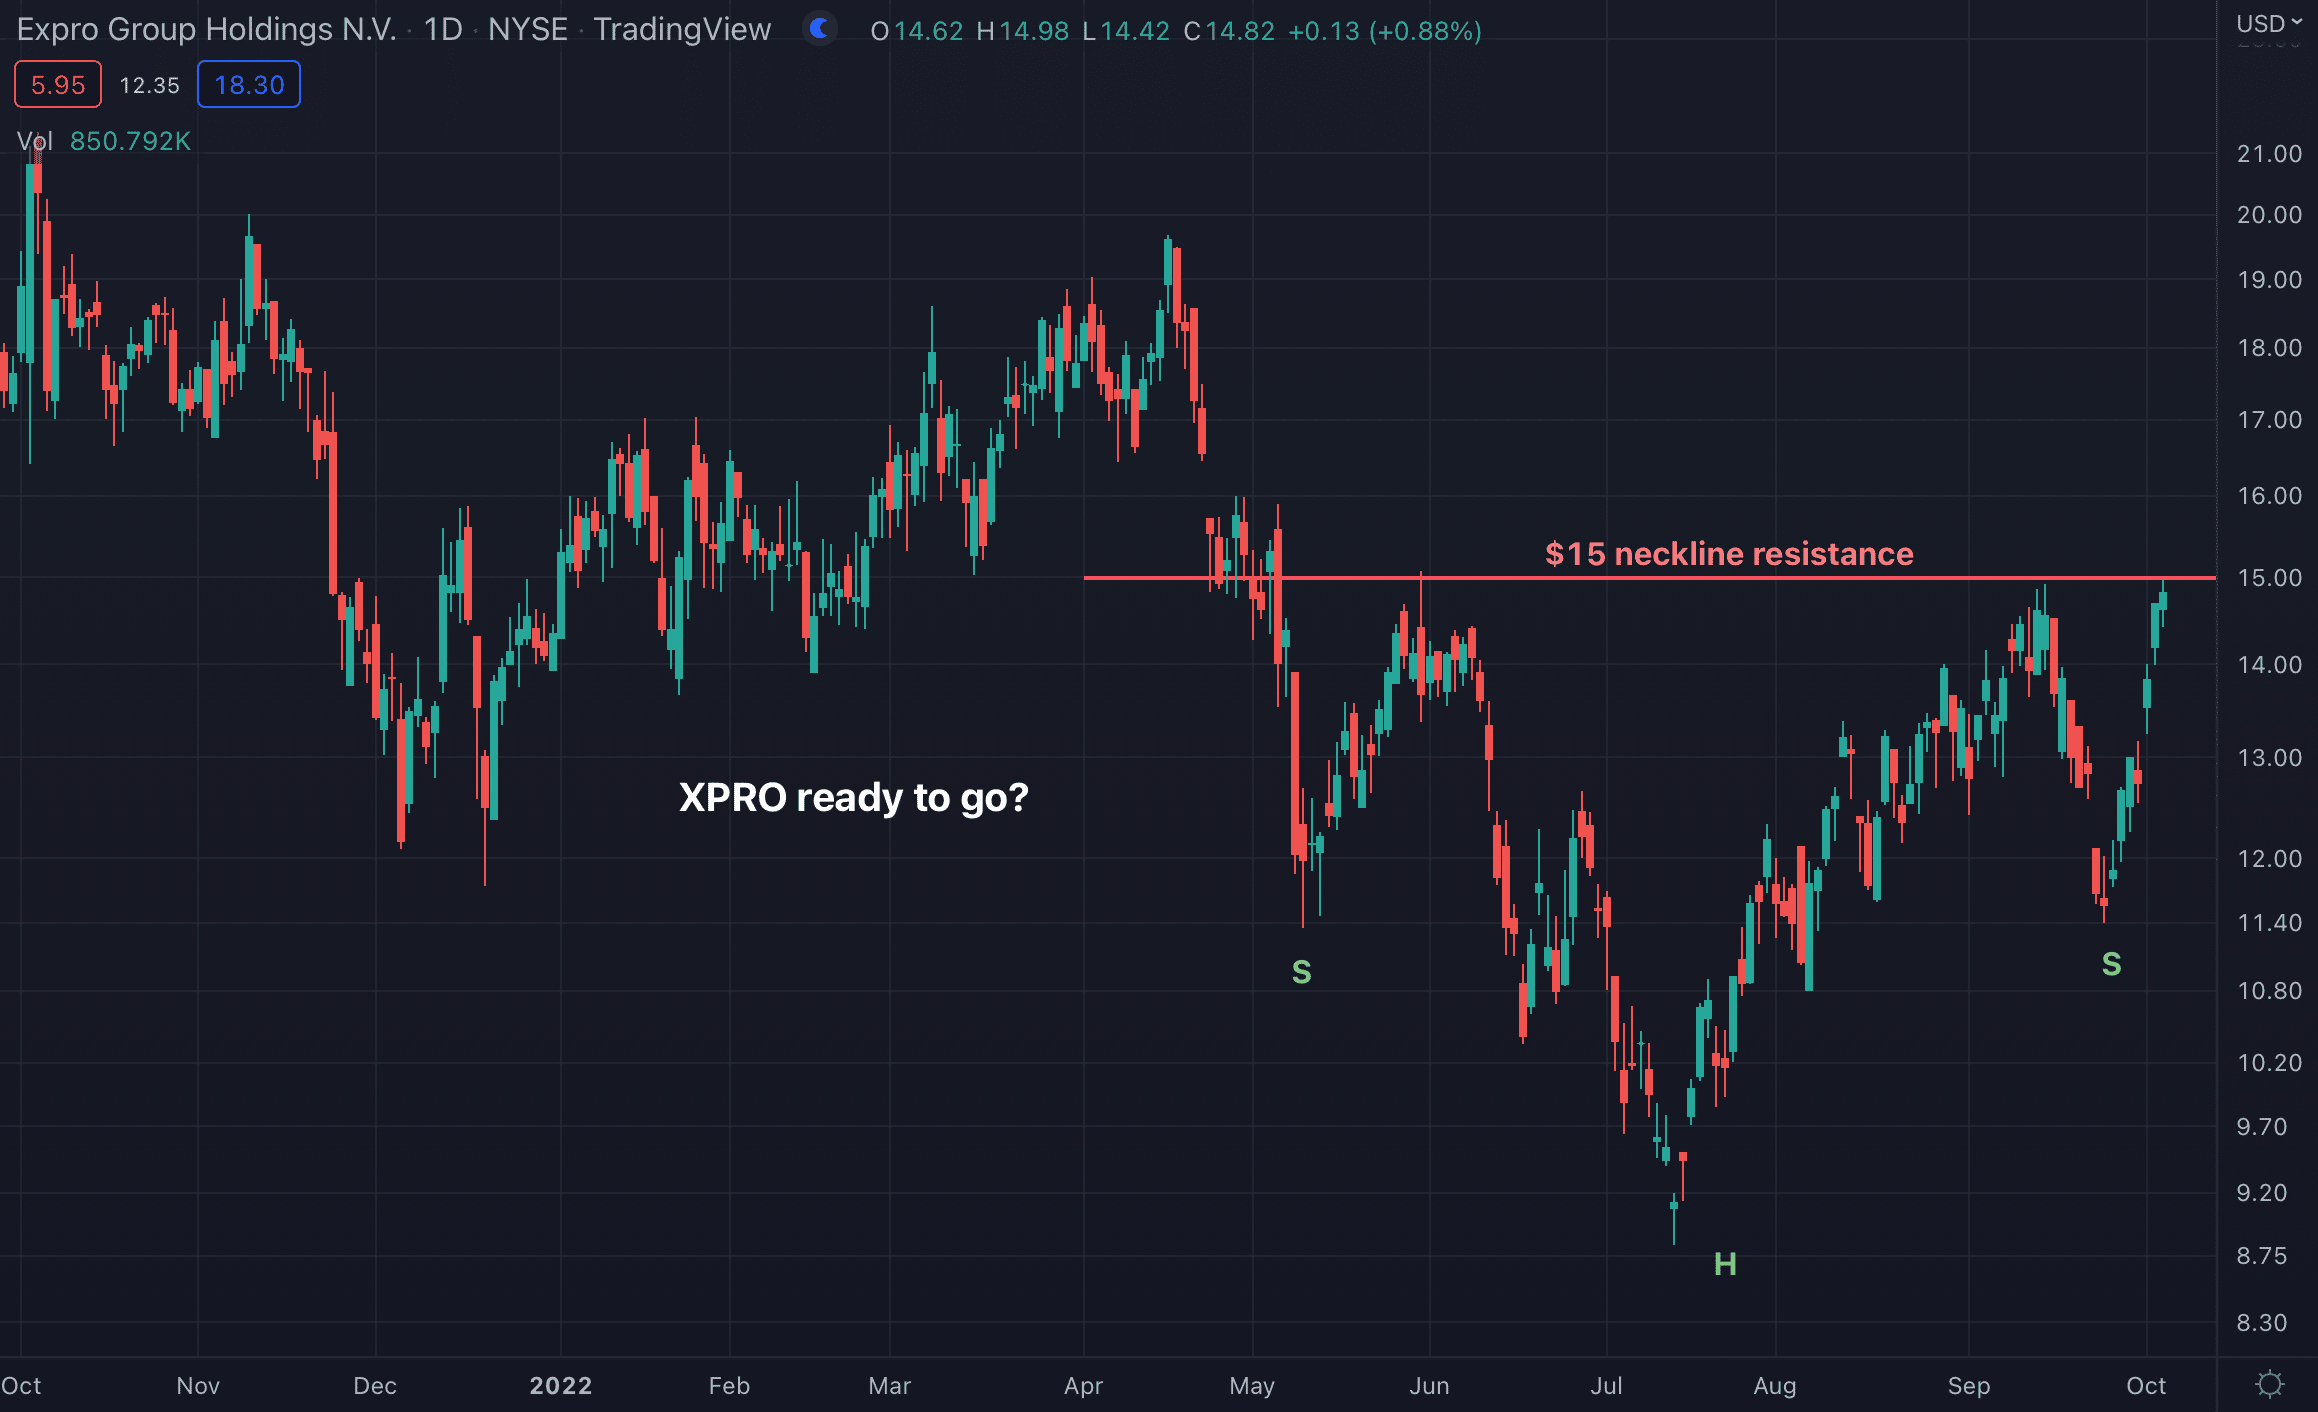
Over the past several months, XPRO has formed an inverse head and shoulders reversal pattern. The head (H) and the shoulders (S) have been noted to make the pattern more visible. The stock’s neckline resistance is sitting at $15 (red). XPRO would confirm its H&S by breaking up through the neckline.
The Tale of the Tape: XPRO has formed an inverse head & shoulders pattern. A long trade could be entered on a break through the $15 neckline, with a stop set below that level.
Before making any trading decision, decide which side of the trade you believe gives you the highest probability of success. Do you prefer the short side of the market, long side, or do you want to be in the market at all? If you haven’t thought about it, review the overall indices themselves. For example, take a look at the S&P 500. Is it trending higher or lower? Has it recently broken through a key resistance or support level? Making these decisions ahead of time will help you decide which side of the trade you believe gives you the best opportunities.
No matter what your strategy or when you decide to enter, always remember to use protective stops and you’ll be around for the next trade. Capital preservation is always key…
Good luck!
Christian Tharp, CMT