
Understanding Variability and Volatility and Why They Matter to Your Portfolio
Share

If you are tired of the abundance of jargon in the world of finance, you are probably wondering why you should read an article about two words that typify this type of vocabulary: variability and volatility.
Now, I understand we get tired of them, but some words are so important that if we understand what they mean and how important they are, it is worth the time to embrace them. Variability and volatility are examples of two such words.
Understanding variability and volatility will help you make the right investment decisions. Knowing the meaning of these terms can make the difference between having a successful portfolio that minimizes risk and maximizes return and a failed portfolio that doesn’t meet your financial goals.
In this article, we consider the following:
- The place of risk in investment decisions
- What is variability?
- What is volatility?
- Variability, volatility, and risk premium
- Variability, volatility, and portfolio diversification
So, let’s explore these terms together.
The Place of Risk in Investment Decisions
To understand why these two finance concepts are important, we need to spend a moment considering the place of risk in investment decisions.
“Rule No. 1: Never lose money. Rule No. 2: Never forget rule No. 1,” said Warren Buffett, the CEO of Berkshire Hathaway. In the investing world, keeping your money is as important as growing it since it is only money that is not lost that can be grown. The potential returns of an asset are irrelevant if you lose that asset.
Therefore, the risk of an asset is as important as the returns.
Harry Markowitz developed the Modern Portfolio Theory to help investors combine risk and returns when evaluating potential investments. His development of the efficient frontier—a number of portfolios that provide the highest level of returns for a given level of risk—has revolutionized investing. Now, investors can measure risk and returns and choose a portfolio that minimizes the former and maximizes the latter.
A consideration of risk is especially important in retirement planning.
The goal of retirement planning is to retire with a big enough nest egg to last till death. Investing in a juicy asset that promises high returns might sound enticing (enough money to go on vacation during retirement), but consider the downside: you lose all the money, and you have to retire on $0 (or something close to zero).
Financial advisers and wealth managers must also learn to consider the place of risk in investing.
“What if your adviser talks only about returns, not risk?” William Sharpe, a Nobel Prize winner in Economic Sciences, once asked. “It’s his job to take risk into account by telling you the range of possible outcomes you face. If he won’t, go to a new planner, someone who will get real.”
So, why is any of the above relevant to the topic?
Variability and volatility are standard ways of measuring the risk of an asset. They help investors understand the risk of an investment so they can compare it with the returns and make a smart decision.
Now, let’s get down to business.
What Is Variability?
Generally, variability is a concept that shows how diverse or spread out something is. For example, water coming from a tap has less variability, while the water coming from a shower has more variability. The former is coming out from one single point, while the latter comes out from various points.
In statistics, variability measures how much data points diverge or vary from one another or the mean.
If the marks of three students in a class are 52, 53, and 54, it shows less variability than if the scores are 52, 65, and 79. The latter is more diverse and spread out, ranging from 52 to 79, while the former only ranges from 52 to 54.
In finance, variability measures how spread out or diverse an asset’s returns are or are likely to be.
For example, let’s say Stock A has had past returns that include 10%, 50%, -15%, 1%, and 100%. It has higher variability than stock B, which has had past returns that include 10%, 15%, 20%, 25%, and 5%.
One important point to note here is that in the world of finance, investors use variability to define the nature or personality of an asset. Therefore, it is not a measure of how spread out or diverse an asset’s returns are over a defined period. Rather, it is a statement about the general nature of an asset’s returns. For example, stocks have higher variability than bonds, and mutual funds have higher variability than savings accounts.
Variability and Risk
How, then, is variability related to risk?
If an asset can have 10% returns today and 50% tomorrow, and then -15% the next day, it is riskier than an asset that will have 10% returns today, 15% tomorrow, and 20% the next day. The closer the returns of an asset to each other, the more predictable they are, and vice versa.
The less predictable an asset’s returns, the more the uncertainty, and greater uncertainty means greater risk.
Consequently, bonds, with more predictable and less diverse returns, are less risky than stocks, with less predictable and more diverse returns.
What Is Volatility?
Volatility is variability applied over a defined period.
While variability considers an asset’s general nature and personality, volatility zeros in on a specific period. Consequently, we can measure the daily, weekly, monthly, and yearly volatility of an asset.
In finance, volatility measures how much returns deviate from each other or from the mean over a defined period.
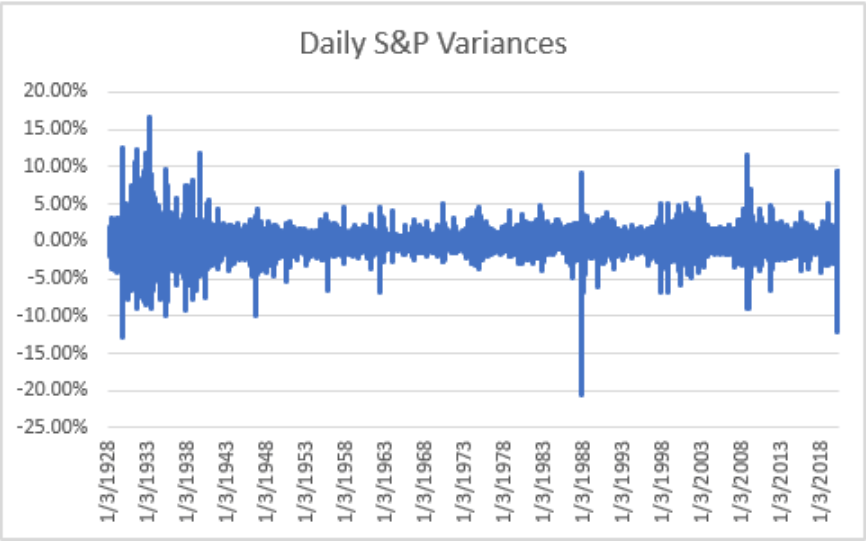
For example, the chart below shows the daily volatility of stocks (using the S&P 500 index) for selected days from 1928 to 2018.
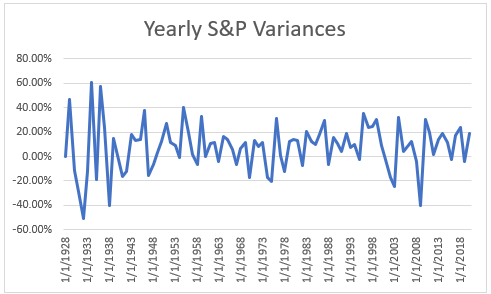
Below is the yearly variance covering the same defined period.
Measuring Volatility
Experts have come up with various ways to measure the volatility of an asset. The popular ones (from the least popular to the most popular) include:
1) Range: The range of a data set is the difference between the highest and the lowest number. If a stock’s returns over the past 7 days are 12%, 17%, 21%, 26%, 30%, 15%, and 10%, the range is 20% (30%-10%). Some believe that this difference between the largest and the smallest value is a good measure of volatility.
2) Average True Range (ATR): ATR measures how much the prices of an asset move over a defined period (usually 14 days). It combines elements of the mean and the range. It is the average (mean) of the true ranges of an asset over a given period (intraday, daily, weekly, monthly).
3) Variance: Variance measures how much a set of data points deviate from the mean. It is the sum of the square of all deviations from the mean divided by the number of items in the data set. Continuing with the example under range, the mean of those seven returns is 18.7 (131/7). The deviation from the mean for each return is the return minus the mean. For the first return (12%), the deviation is -6.7%. When you square all seven deviations from the mean and add them together, and then divide the figure by 7, you have the variance. The variance of the above data set is 46.2.
4) Standard deviation: The most popular measurement of volatility is the standard deviation. The standard deviation is the square root of the variance. So, in the above example, the standard deviation is 6.8. Finance experts prefer standard deviation as a measurement of volatility because its value is within the range of the original data set. The variance, 46.2, is outside the range of the original data (the highest value is 30), but the standard deviation, 6.8, is within that range. So, it makes more sense to say that the returns of this asset have a standard deviation of 6.8% from the mean.
Volatility in Relation to the Market
Investors also try to measure the volatility of an asset in relation to the entire market.
Here, the goal is to understand how much an asset moves in response to changes in the market. If an asset moves faster than the market, it is more volatile than an asset that moves at the pace of the market. And an asset that moves at the pace of the market is more volatile than an asset that moves at a slower rate than the market.
The standard measurement investors use is the beta.
While range, ATR, variance, and standard deviation measure the unsystematic risk of an asset (risks specific to the asset), beta measures the systematic risk of an asset (risks common to the entire market).
Beta is calculated as the covariance of the expected return of the market and the expected return of the asset divided by the variance of the expected return of the asset.
A beta value less than 1 means the asset is less volatile compared to the market. A beta value of 1 means the asset is as volatile as the entire market. And a beta value greater than 1 means the asset is more volatile than the market.
The more volatile an asset is in relation to the market, the higher the systematic risk of the asset (in essence, the higher the beta, the higher the systematic risk).
Types of Volatility
There are two major types of volatility:
1) Historical volatility. As the name implies, it measures the volatility of the past or historical returns of an asset to understand the possible future volatility of the asset.
While the asset may become less risky going forward, it is conservative and much safer to assume that historical volatility is a good gauge of future volatility. In investing, hope is not a strategy.
2) Implied volatility. Implied volatility is more future-looking. It is the market’s perception of what volatility will likely be going forward. It is more common in the options trading market.
Volatility and Risk
So, how does volatility affect you?
Volatility is relevant to you as an investor because it tells you how risky an asset is.
The more volatile an asset, the riskier it is (whether systematic or unsystematic). Therefore, when evaluating an asset, you want to know the risk of the asset as well as the return since the risk will determine whether you lose your money or not. And remember Warren Buffet’s rule 1: Never lose money.
This is also important in retirement planning.
If an asset can grow 10% this year and then fall 50% a year after or if a 50% fall in the market can cause a 100% fall in the asset, you would be more careful about including such an asset in your portfolio, especially if you are already near retirement.
No one said it better than Warren Buffett:
“I am willing to trade the pains (forget about the pleasures) of substantial short-term variance in exchange for maximization of long-term performance. However, I am not willing to incur the risk of substantial permanent capital loss in seeking better long-term performance” (emphasis mine).
The need to protect your investments so they can have that long-term performance is why volatility matters.
“Volatility matters,” said Peter Bernstein, a financial historian and economist, “because it defines the uncertainty of the price at which an asset will be liquidated.”
The more uncertain you are about the price at which an asset will be liquidated because of its volatility, the riskier the asset. So, considering volatility as a measure of risk is very important.
Variability, Volatility, and Risk Premium
Now, let’s take some time to look at how all the above impact your portfolio.
The first thing is to understand, as Harry Markowitz noted, that the goal of the investor is to maximize returns for a given level of risk or minimize risk for a given level of returns. When you buy an asset, you want to ensure the returns you are expecting are worth the risk you are taking on. You should only take on more risk for more returns and fewer returns only for lesser risk.
This is why the concept of risk premium is so important.
Traditionally, the risk premium of an asset is the returns it is expected to yield over and above the risk-free rate. The risk-free rate is what you will earn in an investment with zero risks (like treasury bonds). So, if you are taking up risk by purchasing an asset, it must give you more returns than if you bought a risk-free asset.
If a risk-free asset’s expected return is 5%, then a risky asset’s expected return must exceed 5%.
The risk premium measures how much the risky asset’s returns exceed the returns of a risk-free asset. Consequently, the higher the risk premium of an asset, the better. If you must choose between an asset with a 4% risk premium and another with a 6% risk premium, the latter is better from a purely returns perspective.
However, the above risk premium formula is too simplistic since it does not include the risk of the asset, and as we have seen, risk is as important as returns. Consequently, a better way to look at this concept is by using the Sharpe ratio. The Sharpe ratio divides the risk premium by the standard deviation of the asset (the measure of risk) to get a figure that reflects both risk and returns.
For example, if the asset with a 4% risk premium has a 1% standard deviation and the one with 6% has a 3% standard deviation, the former is better than the latter because it has a higher Sharpe ratio (400%) than the latter (200%).
Simply put, the higher the Sharpe ratio of an asset, the better.
If asset A has a higher Sharpe ratio than B, it means that the return-risk ratio of A is higher than B and a smart investor is better off investing in A rather than B.
Without an understanding of risk and volatility, you will be stuck with only risk premium as a way of comparing assets. However, with volatility and risk, you can compare assets with the Sharpe ratio and combine both return and risk to make a better decision.
Variability, Volatility, and Portfolio Diversification
Harry Markowitz believed that the best way to minimize risk and maximize returns is to have a portfolio of assets that are less correlated to each other (a diversified portfolio).
The more diversified a portfolio, the higher the Sharpe ratio. So instead of choosing one asset with a good Sharpe ratio, a combination of assets that are less correlated to one another, will yield a higher Sharpe ratio—maximizing returns for a given level of risk.
According to modern portfolio theory, there are many portfolio combinations that can help you achieve that goal—maximize returns for a given level of risk, vice versa.
All portfolios that lie on the efficient frontier will maximize returns for a given level of risk and minimize risk for a given level of returns. So which portfolio should you choose? You should choose a portfolio that aligns with your risk tolerance.
Talking about financial advisers, Harry Markowitz said, “Perhaps the most important job of a financial adviser is to get their clients in the right place on the efficient frontier in their portfolios. But their No. 2 job, a very close second, is to create portfolios that their clients are comfortable with.”
The purpose of risk tolerance is to do that second job well.
Whatever your risk tolerance, there is an efficient portfolio for you that yields the highest Sharpe ratio.
Suppose you are a conservative investor who can’t do more than a 5% standard deviation, for example. In that case, there is an efficient portfolio that will maximize your returns for that level of risk. If you are a growth investor who is comfortable with a 15% standard deviation, there is an efficient portfolio that maximizes your returns for that level of risk.
Whether you manage your finances or use a financial adviser, ensure you have an efficient portfolio that is maximizing your returns for your risk tolerance level.
Conclusion
Excitement over returns that ignores risk is a recipe for financial loss. Use this understanding of variability and volatility to evaluate the risk and returns of your individual investments so you can always make prudent financial decisions.