
Truist Financial (TFC) Tests 52-Week Low
Share

Truist Financial Corp. operates as a financial holding company, which engages in the provision of banking services to individuals, businesses, and municipalities. The firm operates through the following segments: Consumer Banking and Wealth, Corporate and Commercial Banking, and Insurance Holdings.
Take a look at the 1-year chart of Truist (NYSE: TFC) below with added notations:
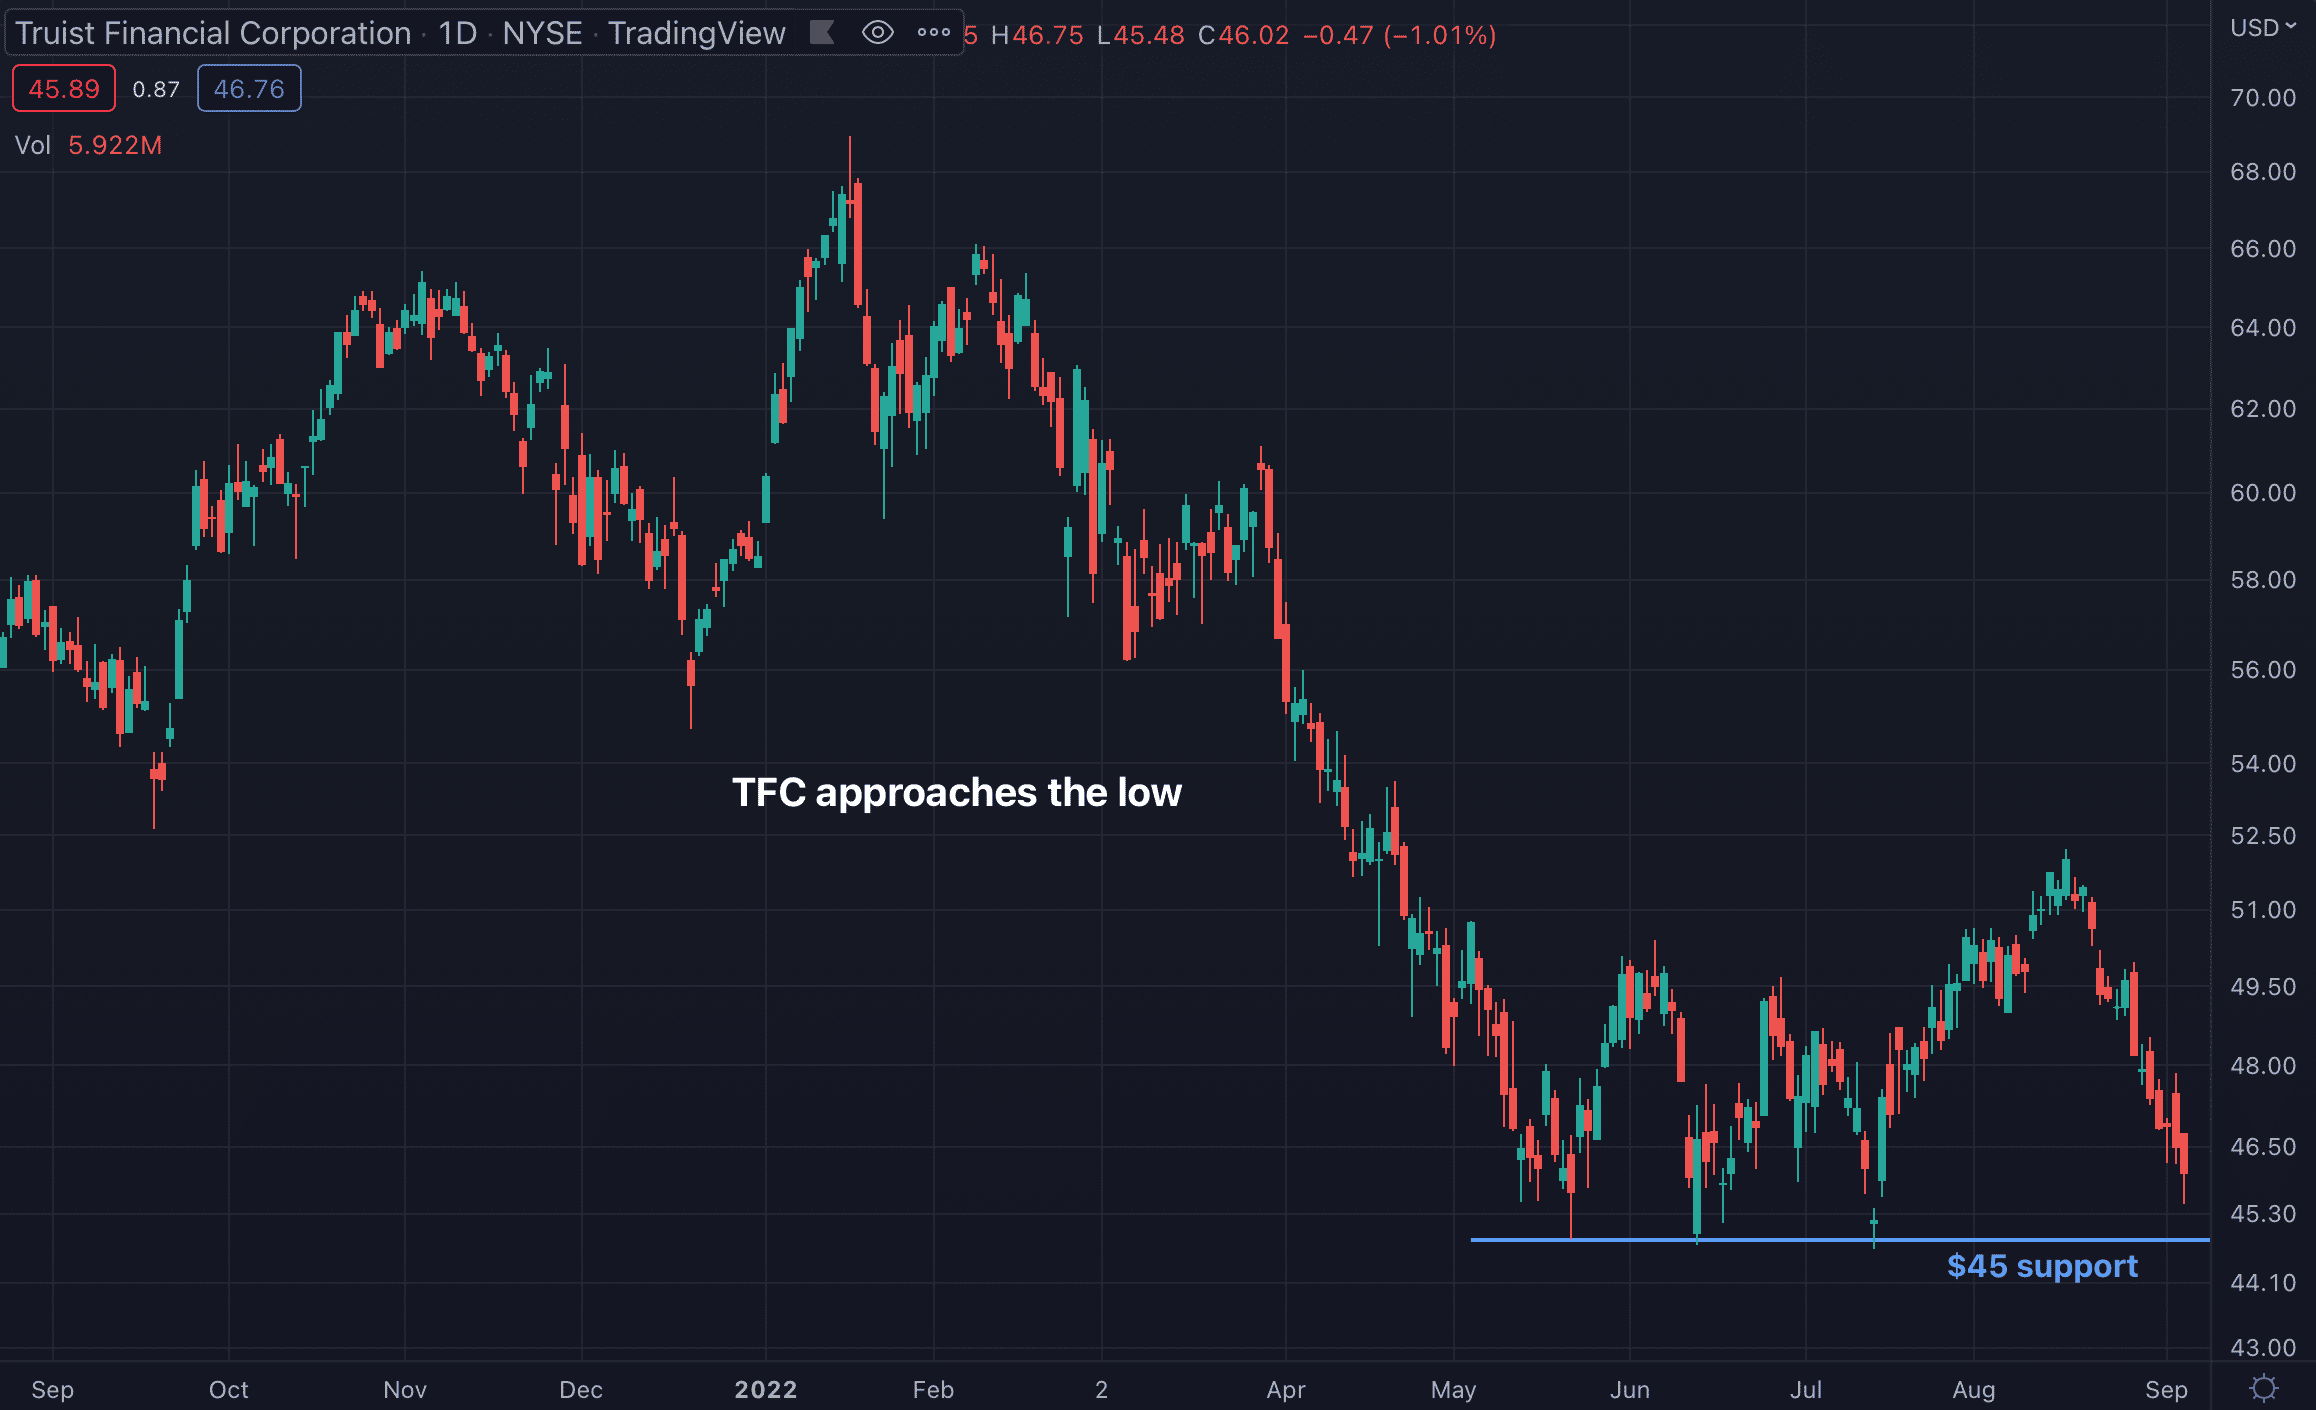
TFC created an important 52-week low support (blue) back in May, June and July, with the final test of that support leading to a multi-week rally. However, the stock has been on the decline for the past two weeks and appears to be making a straight line towards its $45 support.
The Tale of the Tape: TFC has key 52-week low support at $45. A trader could enter a long position at or around the mark with a stop placed under it. If the stock were to break below the support, a short position could be entered instead.
Before making any trading decision, decide which side of the trade you believe gives you the highest probability of success. Do you prefer the short side of the market, long side, or do you want to be in the market at all? If you haven’t thought about it, review the overall indices themselves. For example, take a look at the S&P 500. Is it trending higher or lower? Has it recently broken through a key resistance or support level? Making these decisions ahead of time will help you decide which side of the trade you believe gives you the best opportunities.
No matter what your strategy or when you decide to enter, always remember to use protective stops and you’ll be around for the next trade. Capital preservation is always key…
Good luck!
Christian Tharp, CMT