Type to search

Todays Big Stock Wealthpop News

Watch For Steel Dynamics (STLD) To Possibly Break Major Resistance

Share

Steel Dynamics, Inc. engages in the manufacture of steel products and metal recycling. It operates through the following segments: Steel Operations, Metals Recycling Operations, and Steel Fabrication Operations.

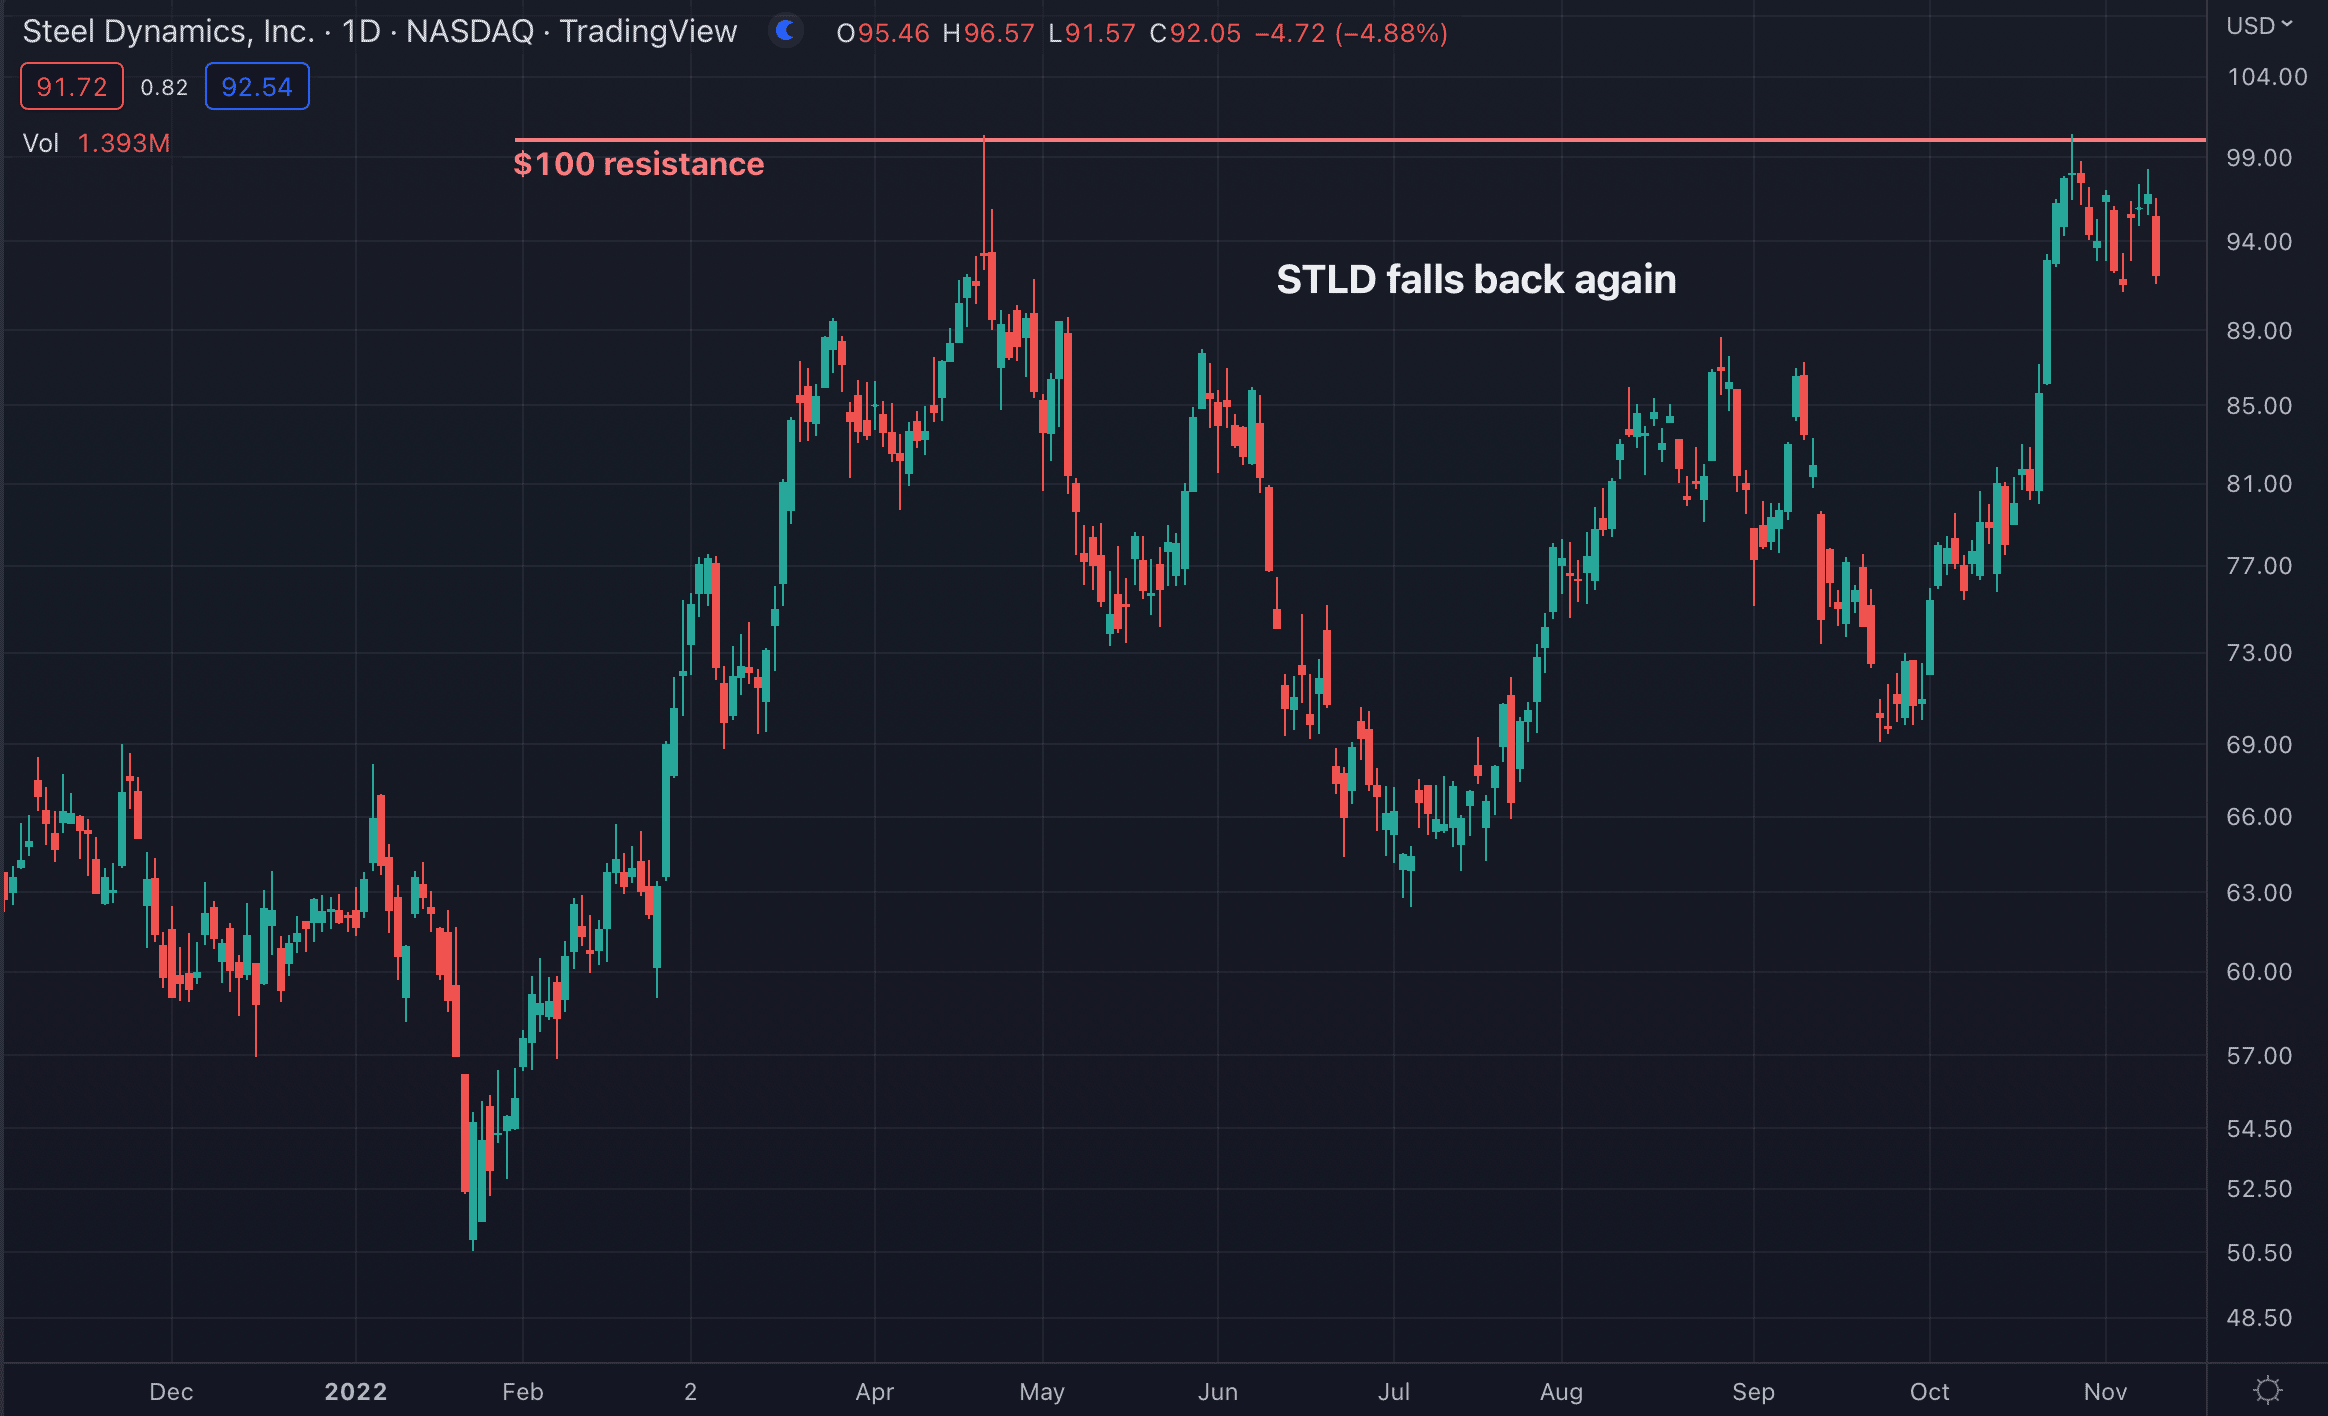
Take a look at the 1-year chart of Steel Dynamics (STLD) below with the added notations:

Chart of STLD provided by TradingView

Twice over the past six months, STLD has stalled at its $100 resistance (red) level. That level is also the stock’s 52-week high barrier. A break above that $100 mark most likely means another leg higher for STLD.

The Tale of the Tape: STLD has a 52-week resistance at $100. The possible long position on the stock would be on a breakout above that level with a stop placed under it.

Before making any trading decision, decide which side of the trade you believe gives you the highest probability of success. Do you prefer the short side of the market, long side, or do you want to be in the market at all? If you haven’t thought about it, review the overall indices themselves. For example, take a look at the S&P 500. Is it trending higher or lower? Has it recently broken through a key resistance or support level? Making these decisions ahead of time will help you decide which side of the trade you believe gives you the best opportunities.

No matter what your strategy or when you decide to enter, always remember to use protective stops and you’ll be around for the next trade. Capital preservation is always key…

Good luck!

Christian Tharp, CMT

ATTENTION READERS!

Don’t make another trade until you watch this video:

Tags:
Christian Tharp

I am an expert stock market coach having helped over 4000 beginner and advanced traders & investors from around the world take control of their financial futures. I also write stock market related articles for the Adam Mesh Trading Group. My Chartered Market Technician (CMT) designation substantiates me as an expert in areas such as the technical analysis of stock trends, market indicators, cycles, price patterns, Elliot Wave principles, Candlestick charting, analyzing financial trends and behaviors, portfolio strategies, and forecasting future price movements. With my straightforward approach to simple, systematic trading, students learn how to strategically assess buy signals and market entry timing, establishment and management of stop losses, and how to employ a simple and disciplined trading approach that creates profits.

  • 1

Leave a Comment

Your email address will not be published. Required fields are marked *

×

It's not goodbye, it's hello Magnifi!

You are now leaving a Magnifi Communities' website and are going to a website that is not operated by Magnifi Communities. This website is operated by Magnifi LLC, an SEC registered investment adviser affiliated with Magnifi Communities.

Magnifi Communities does not endorse this website, its sponsor, or any of the policies, activities, products, or services offered on the site. We are not responsible for the content or availability of linked site.

Take Me To Magnifi