
You’ll Want To See This Chart Of Apellis Pharmaceuticals (ALPS)
Share

Apellis Pharmaceuticals, Inc. is a clinical-stage biopharmaceutical company, which develops novel therapeutic and complement immunotherapies for the treatment of complement-dependent autoimmune and inflammatory diseases through APL-2 product.
Take a look at the 1-year chart of Apellis (APLS) below with the added notations:
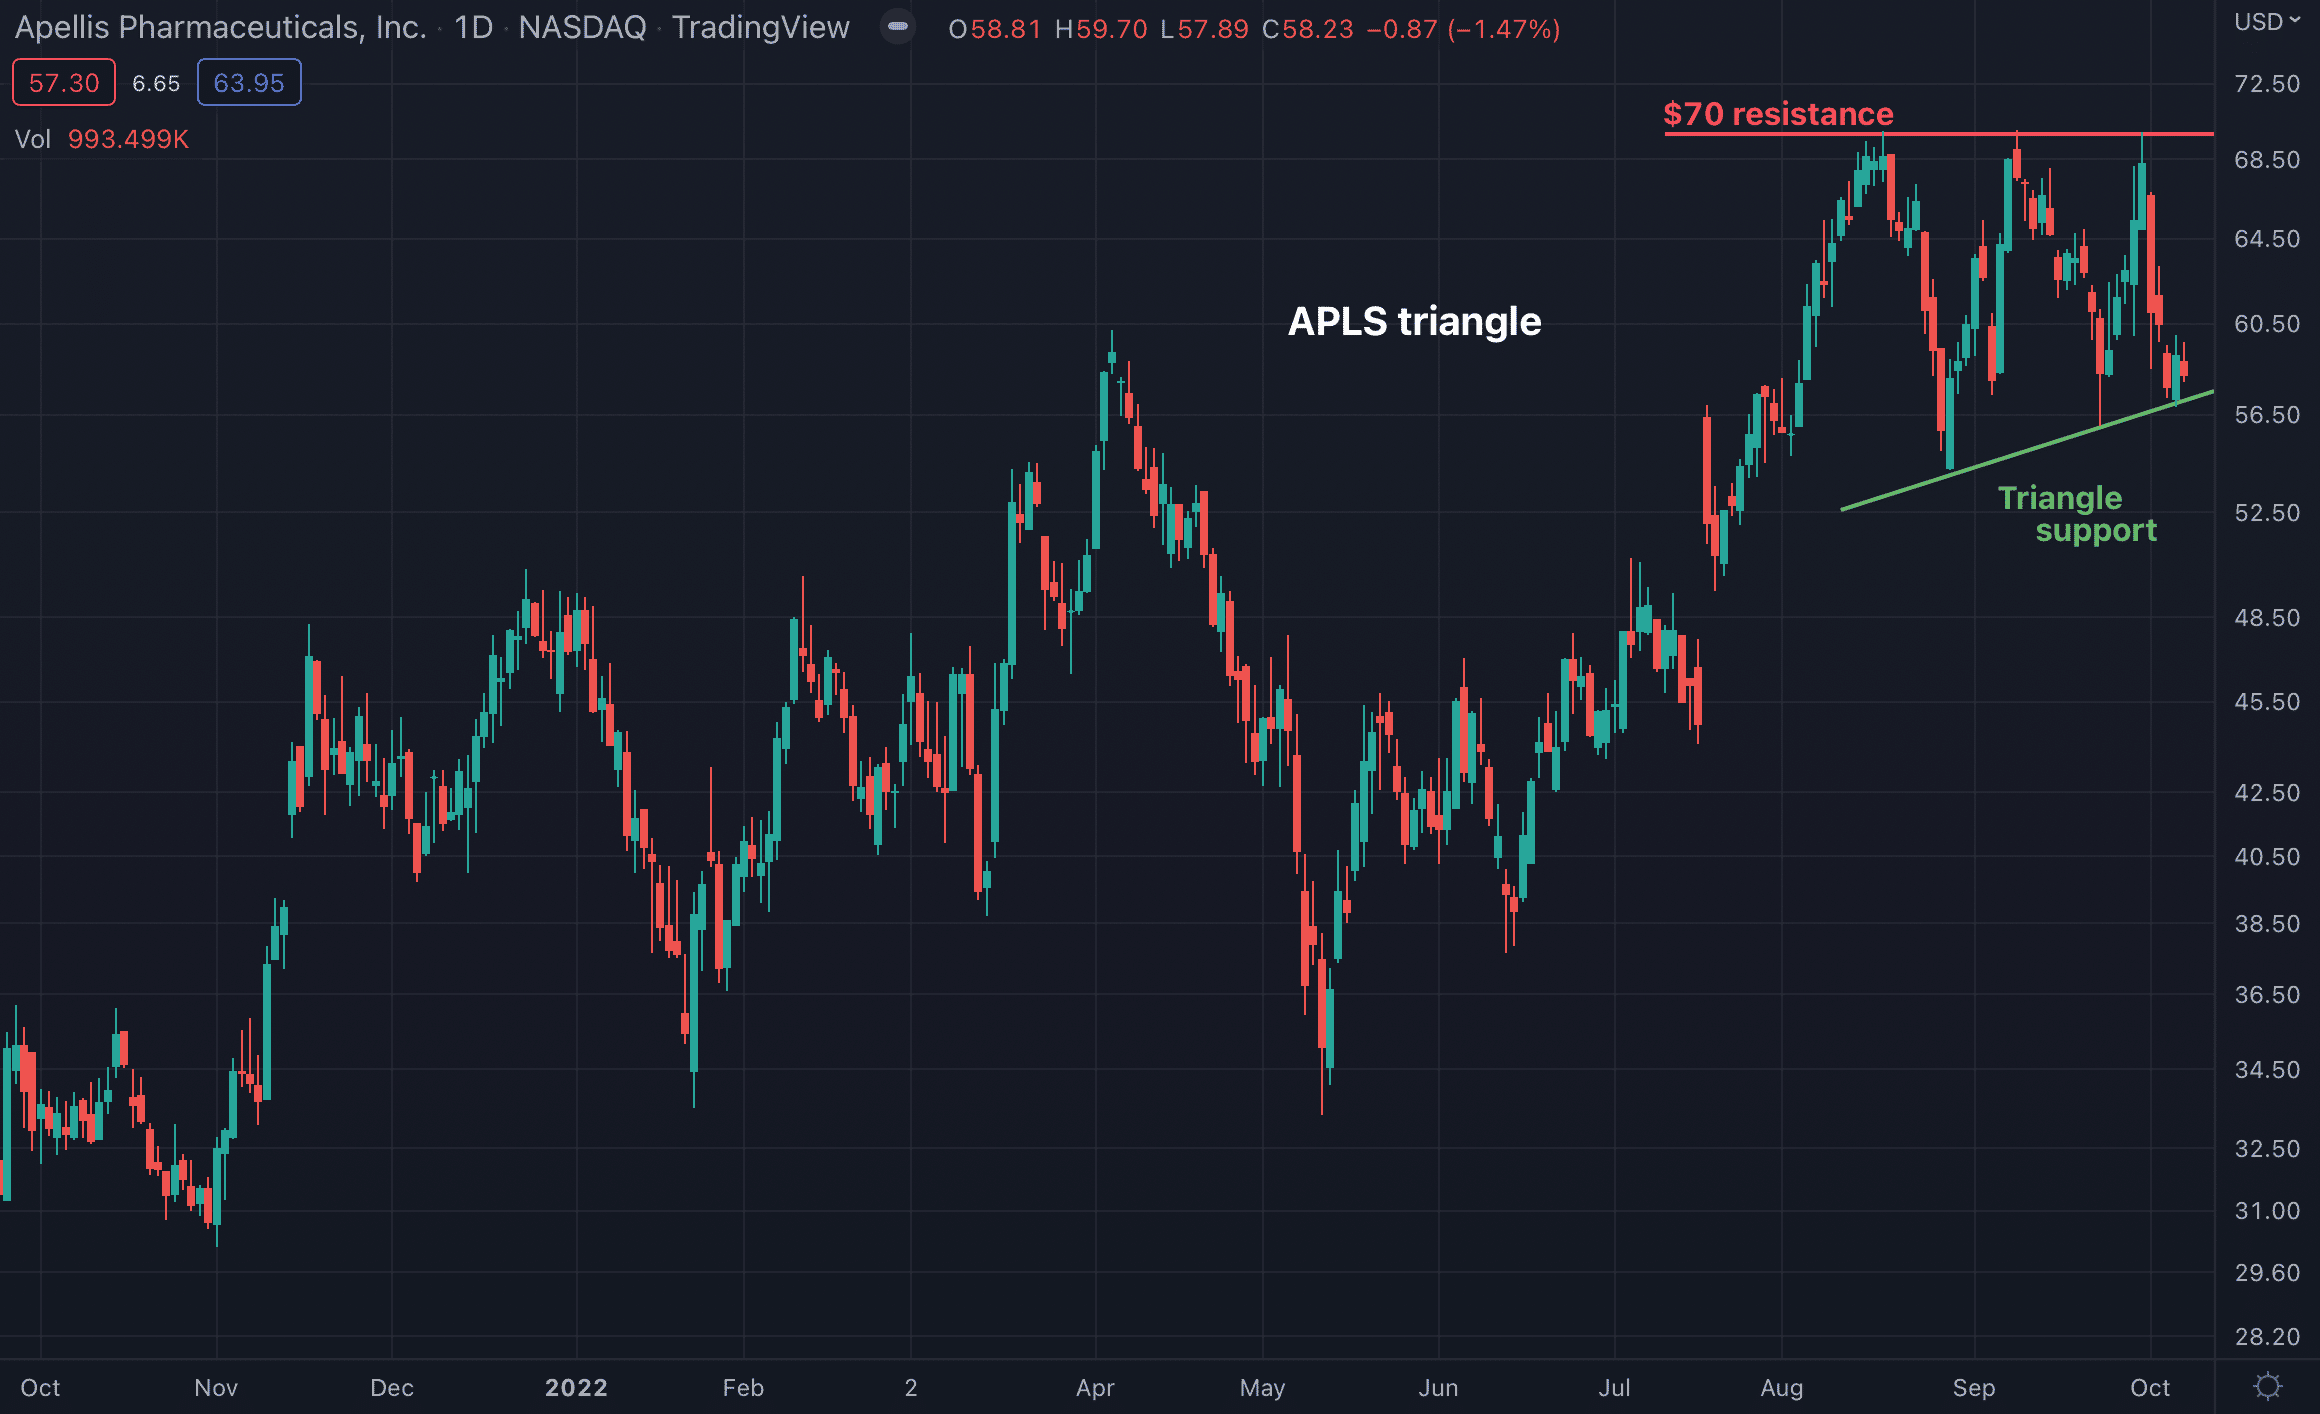
APLS has formed key resistance at $70 (red) over the past two months, while also rising on top of an up-trending support line (green). These two lines have APLS trading within a common pattern known as an ascending triangle. APLS will break out of the triangle eventually, which creates an opportune trade setup.
The Tale of the Tape: APLS has formed a triangle pattern. A short trade could be made on a break of support or on a test of resistance. A long trade could be made at support or on a break through the triangle resistance of $70.
Before making any trading decision, decide which side of the trade you believe gives you the highest probability of success. Do you prefer the short side of the market, long side, or do you want to be in the market at all? If you haven’t thought about it, review the overall indices themselves. For example, take a look at the S&P 500. Is it trending higher or lower? Has it recently broken through a key resistance or support level? Making these decisions ahead of time will help you decide which side of the trade you believe gives you the best opportunities.
No matter what your strategy or when you decide to enter, always remember to use protective stops and you’ll be around for the next trade. Capital preservation is always key…
Good luck!
Christian Tharp, CMT