
1 Bullish Pattern Every Trader Should Know…
Share

Zoom Video Communications, Inc. engages in the provision of video-first communications platform. The firm offers meetings, chat, rooms and workspaces, phone systems, video webinars, marketplace, and developer platform products. It serves the education, finance, government, and healthcare industries. Its platform helps people to connect through voice, chat, content sharing, and face-to-face video experiences.
Take a look at the 1-year chart of Zoom (NASDAQ: ZM) below with the added notations:
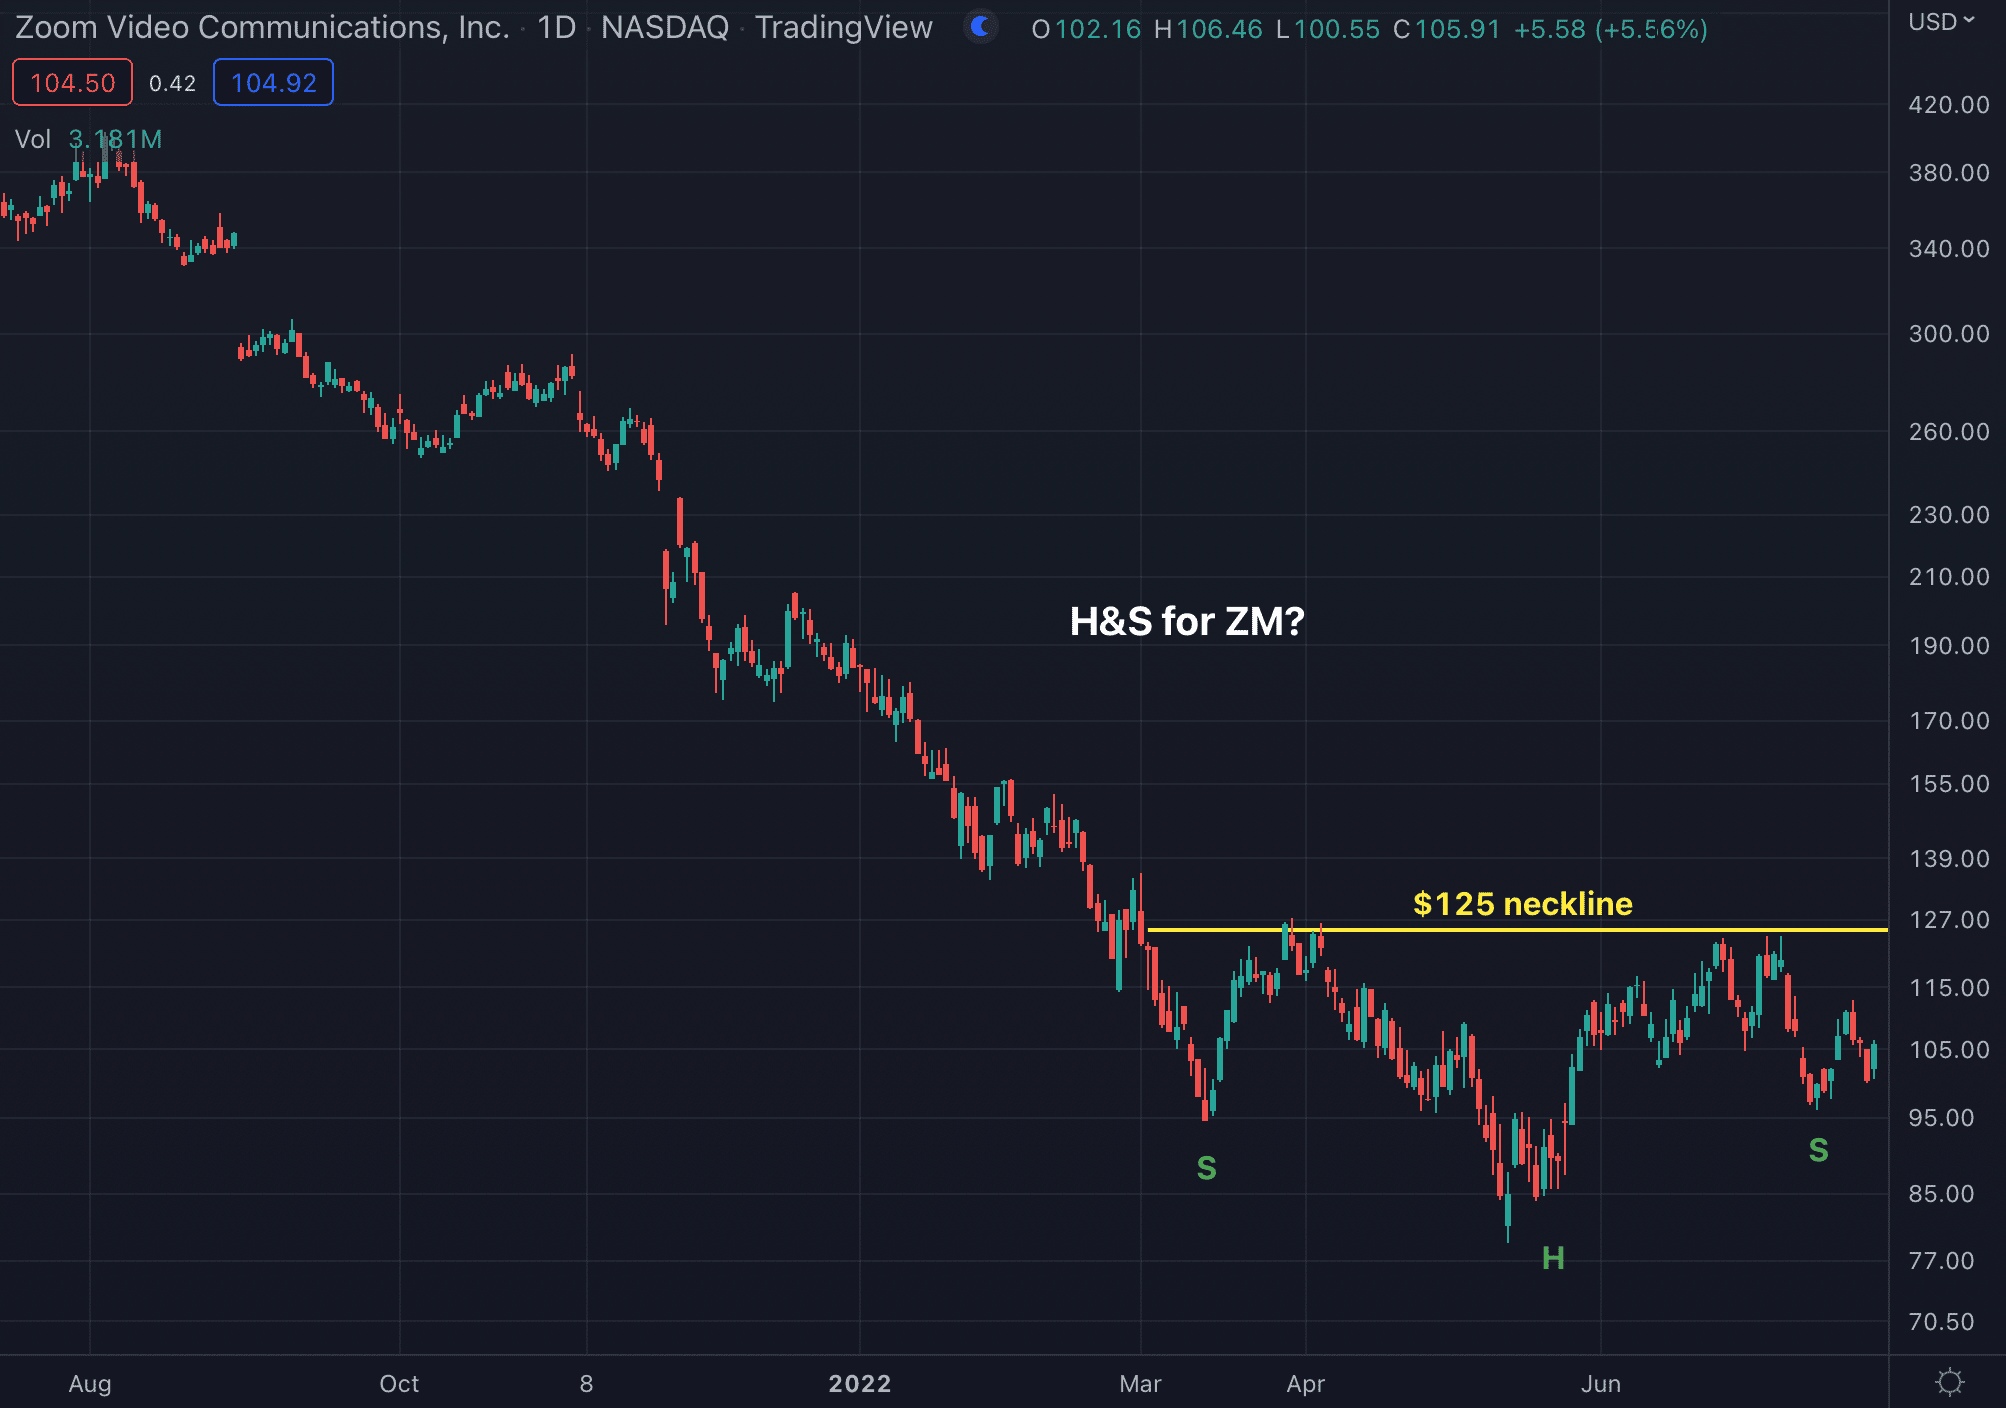
Over the past few months, ZM seems to be forming an inverse head and shoulders reversal pattern. The head (H) and the shoulders (S) have been noted to make the pattern more visible. The stock’s neckline resistance is currently sitting around $125 (yellow). ZM would confirm its H&S by breaking through the neckline.
The Tale of the Tape: ZM may be forming an inverse head & shoulders pattern. A long trade could be entered on a break through the $125 neckline.
Before making any trading decision, decide which side of the trade you believe gives you the highest probability of success. Do you prefer the short side of the market, long side, or do you want to be in the market at all? If you haven’t thought about it, review the overall indices themselves. For example, take a look at the S&P 500. Is it trending higher or lower? Has it recently broken through a key resistance or support level? Making these decisions ahead of time will help you decide which side of the trade you believe gives you the best opportunities.
No matter what your strategy or when you decide to enter, always remember to use protective stops and you’ll be around for the next trade. Capital preservation is always key!
Good luck!
Christian Tharp, CMT
ATTENTION SUBSCRIBERS!
Do not trade options until you watch my urgent message: