
Is Constellation Energy (CEG) Ready For New Highs?
Share

Constellation Energy Corp. engages in the generation, supply, and marketing of clean energy electricity, and renewable energy products and solutions. It operates under the following geographical segments: Mid-Atlantic, Midwest, New York, Texas, and Other Power Regions Segment.
Take a look at the 9-month chart of Constellation (CEG) below with the added notations:
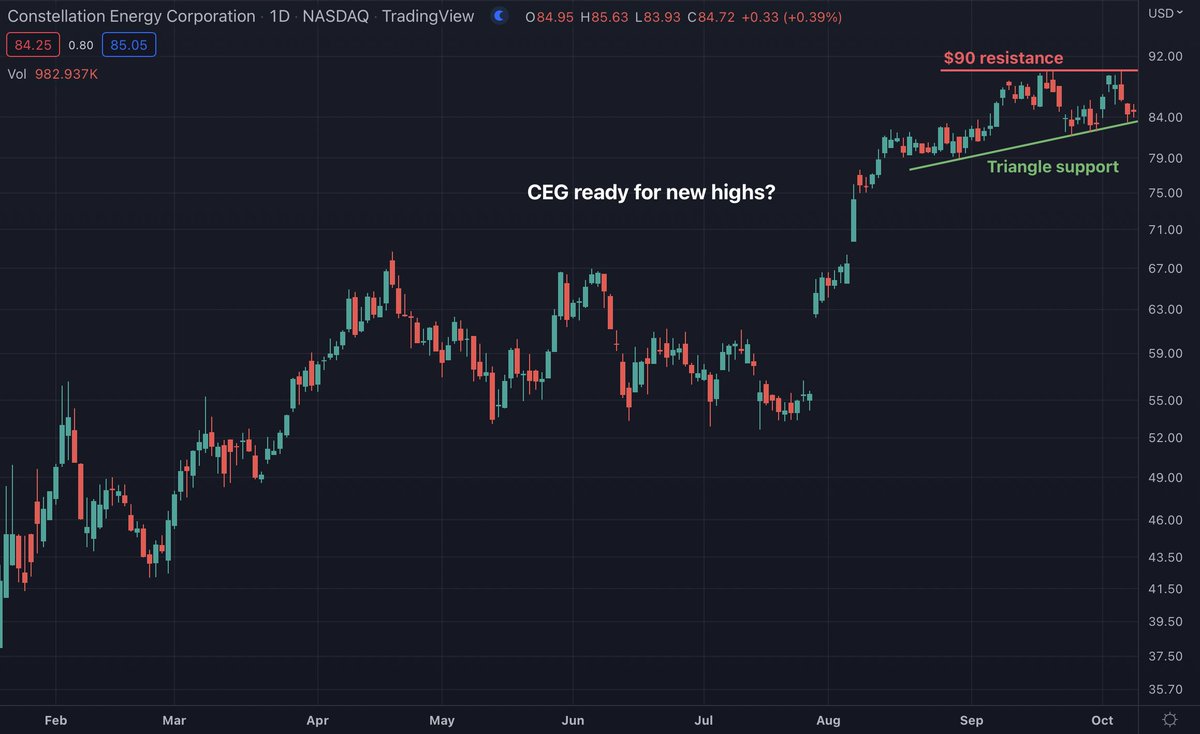
CEG has formed key resistance at $90 (red) over the past several weeks, while also rising on top of an up-trending support line (green). These two lines have CEG trading within a common pattern known as an ascending triangle. CEG will break out of the triangle eventually, which creates an opportunistic trade setup.
The Tale of the Tape: CEG has formed a triangle pattern. A short trade could be made on a break of support or on a test of resistance. A long trade could be made at support or on a break through the triangle resistance of $90.
Before making any trading decision, decide which side of the trade you believe gives you the highest probability of success. Do you prefer the short side of the market, long side, or do you want to be in the market at all? If you haven’t thought about it, review the overall indices themselves. For example, take a look at the S&P 500. Is it trending higher or lower? Has it recently broken through a key resistance or support level? Making these decisions ahead of time will help you decide which side of the trade you believe gives you the best opportunities.
No matter what your strategy or when you decide to enter, always remember to use protective stops and you’ll be around for the next trade. Capital preservation is always key…
Good luck!
Christian Tharp, CMT