
Keep Your Eye On This Indicator With A 88% Win Rate
Share

The S&P 500 and Nasdaq Composite were both down to start last week but closed on their highs to finish up 1.9% and 2.6%, respectively, keeping them well in positive territory on a year-to-date basis. Plus, despite the recent pullback, the bulls defended the S&P 500 near its 200-day moving average and the 50-day is still above the 200-day on the S&P 500 (bullish alignment), there is reason to be somewhat optimistic.
For now, the size of the pullback and the returns and drawdowns from this current breadth thrust signal have been in line with the averages, suggesting this new breadth thrust signal is not abnormal, and we can expect it to play out similarly to past precedents.
(Source: TC2000.com)
However, while the short-term picture has improved since the January lows, this recent strength has not yet translated to an improvement in the grand scheme of things. This is because both indexes remain below their 20-month moving averages (teal line). A confirmatory sign that would increase the success rate of this breadth thrust (achieving a 15%+ return from the signal at 3980 on the S&P 500) would be a monthly close back above the 20-month moving average for the S&P 500.
This level currently comes in at 4210 on the S&P 500, and a monthly close above here would push momentum to bullish on the longer-term chart, similar to what was achieved in April 2020 following the waterfall COVID-19 crash.
Digging into the breadth thrust signal a little closer, we can see that the market has been higher 88% of the time following a breadth thrust on a 12-month forward basis and 85% on a forward six-month basis. The average forward 6-month return is 11.7%, with an average 12-month return of 16.8%. This would place the S&P 500 at 4450 this summer and 4650 at year-end if it were to trade in line with the averages.
So far, as shown in the 5-day, 10-day and 1 month performance/drawdown columns, the market is trading in line with historical signals (above-average returns and very limited drawdowns).
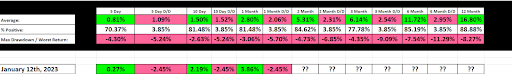
(Source: Market Data, Author’s Table)
Valuation, Sentiment & News
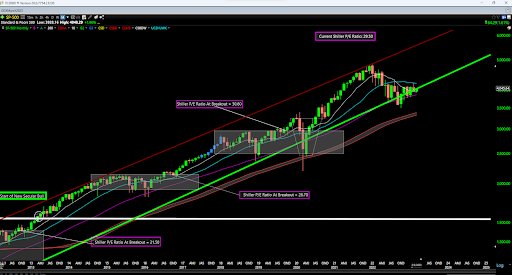
While the S&P 500 remains nearly 20% below its 2022 highs, the market is far from cheap – trading at a Shiller PE ratio just below 30 – well above its long-term average. So, while some investors point to 20% plus corrections in the market as a buying opportunity, this ignores where the market began its correction from. In the case of the Q1 2022 highs, we were at a multi-decade high in terms of valuations, with the market only becoming more expensive in late 1999 and early 2000.
While the 20% market decline has helped to cool off valuations, I disagree with the market being cheap here, and I would argue it’s actually expensive.
As far as sentiment, while we entered January with levels of elevated pessimism that provided a tailwind for the market, we have seen a significant reversion to the mean since that time.
As the chart below shows, the put-call ratio has descended from readings above 1.0 (pessimism) to multiple readings below 0.60 (limited pessimism and minor complacency), suggesting that the setup is no longer favorable from a sentiment standpoint. This is corroborated by other sentiment indicators showing that while we don’t have complacency, we no longer have extreme pessimism.
This means sentiment has flipped to a neutral reading overall, with the edge no longer in favor of the bulls (as it was in January of this year).
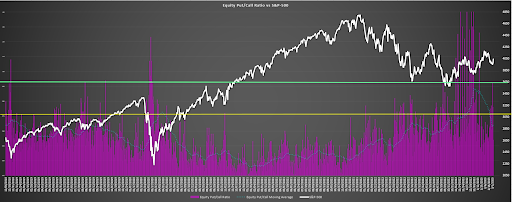
(Source: CBOE Data, Author’s Chart)
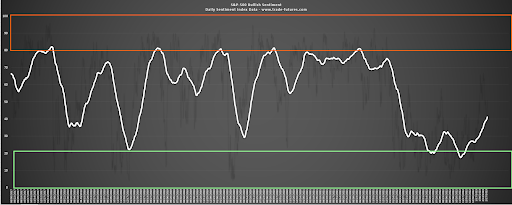
(Source: Daily Sentiment Index Data, Author’s Chart)
Finally, with regard to the news, there wasn’t much to report over the last week. The market continues to digest the Q4 Earnings Season and prepare for what the Federal Reserve might have in store at its meeting later this month (21st, 22nd). Given the strength of the market in Q1 and the sticky nature of inflation, another 25 basis points looks to be the base case, with the potential for 50 basis points if the February inflation reading doesn’t dip below 6.5%. This will also come to suggest inflation is much harder to kill than what many originally expected. Based on this hawkish backdrop, which looked priced into the market at 3600 and not at 4050 where we sit currently, I continue to see some caution being warranted.
So, what’s the best course of action?
Heading into the week, the S&P 500 is back in the upper portion of its strong support/resistance range (3500 vs. 4315) at 4045 and near the mid-point of its range using short-term support at 3765 and resistance at 4315. This translates to a neutral reward/risk setup for the market short term.
Given that I have a low conviction short-term on market direction and we have neutral readings across the board (sentiment, valuation, technicals), I’ll stay picky when it comes to entering new positions in general market names. That’s why I remain 70% invested, and would only be interested in adding to my position if the S&P 500 were to dip closer to support at 3765.
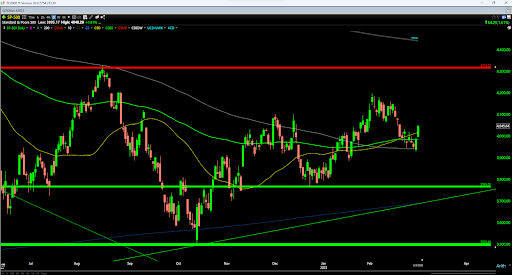
(Source: TC2000.com)