
Kellogg (K) Stalls Out At Strong Resistance
Share
Kellogg Co. engages in the manufacturing, marketing, and distribution of ready-to-eat cereal and convenience foods. The firm markets cookies, crackers, crisps, and other convenience foods, under brands such as Kellogg’s, Cheez-It, Pringles, and Austin to supermarkets in the U.S.
Take a look at the 1-year chart of Kellogg (K) below with the added notations:
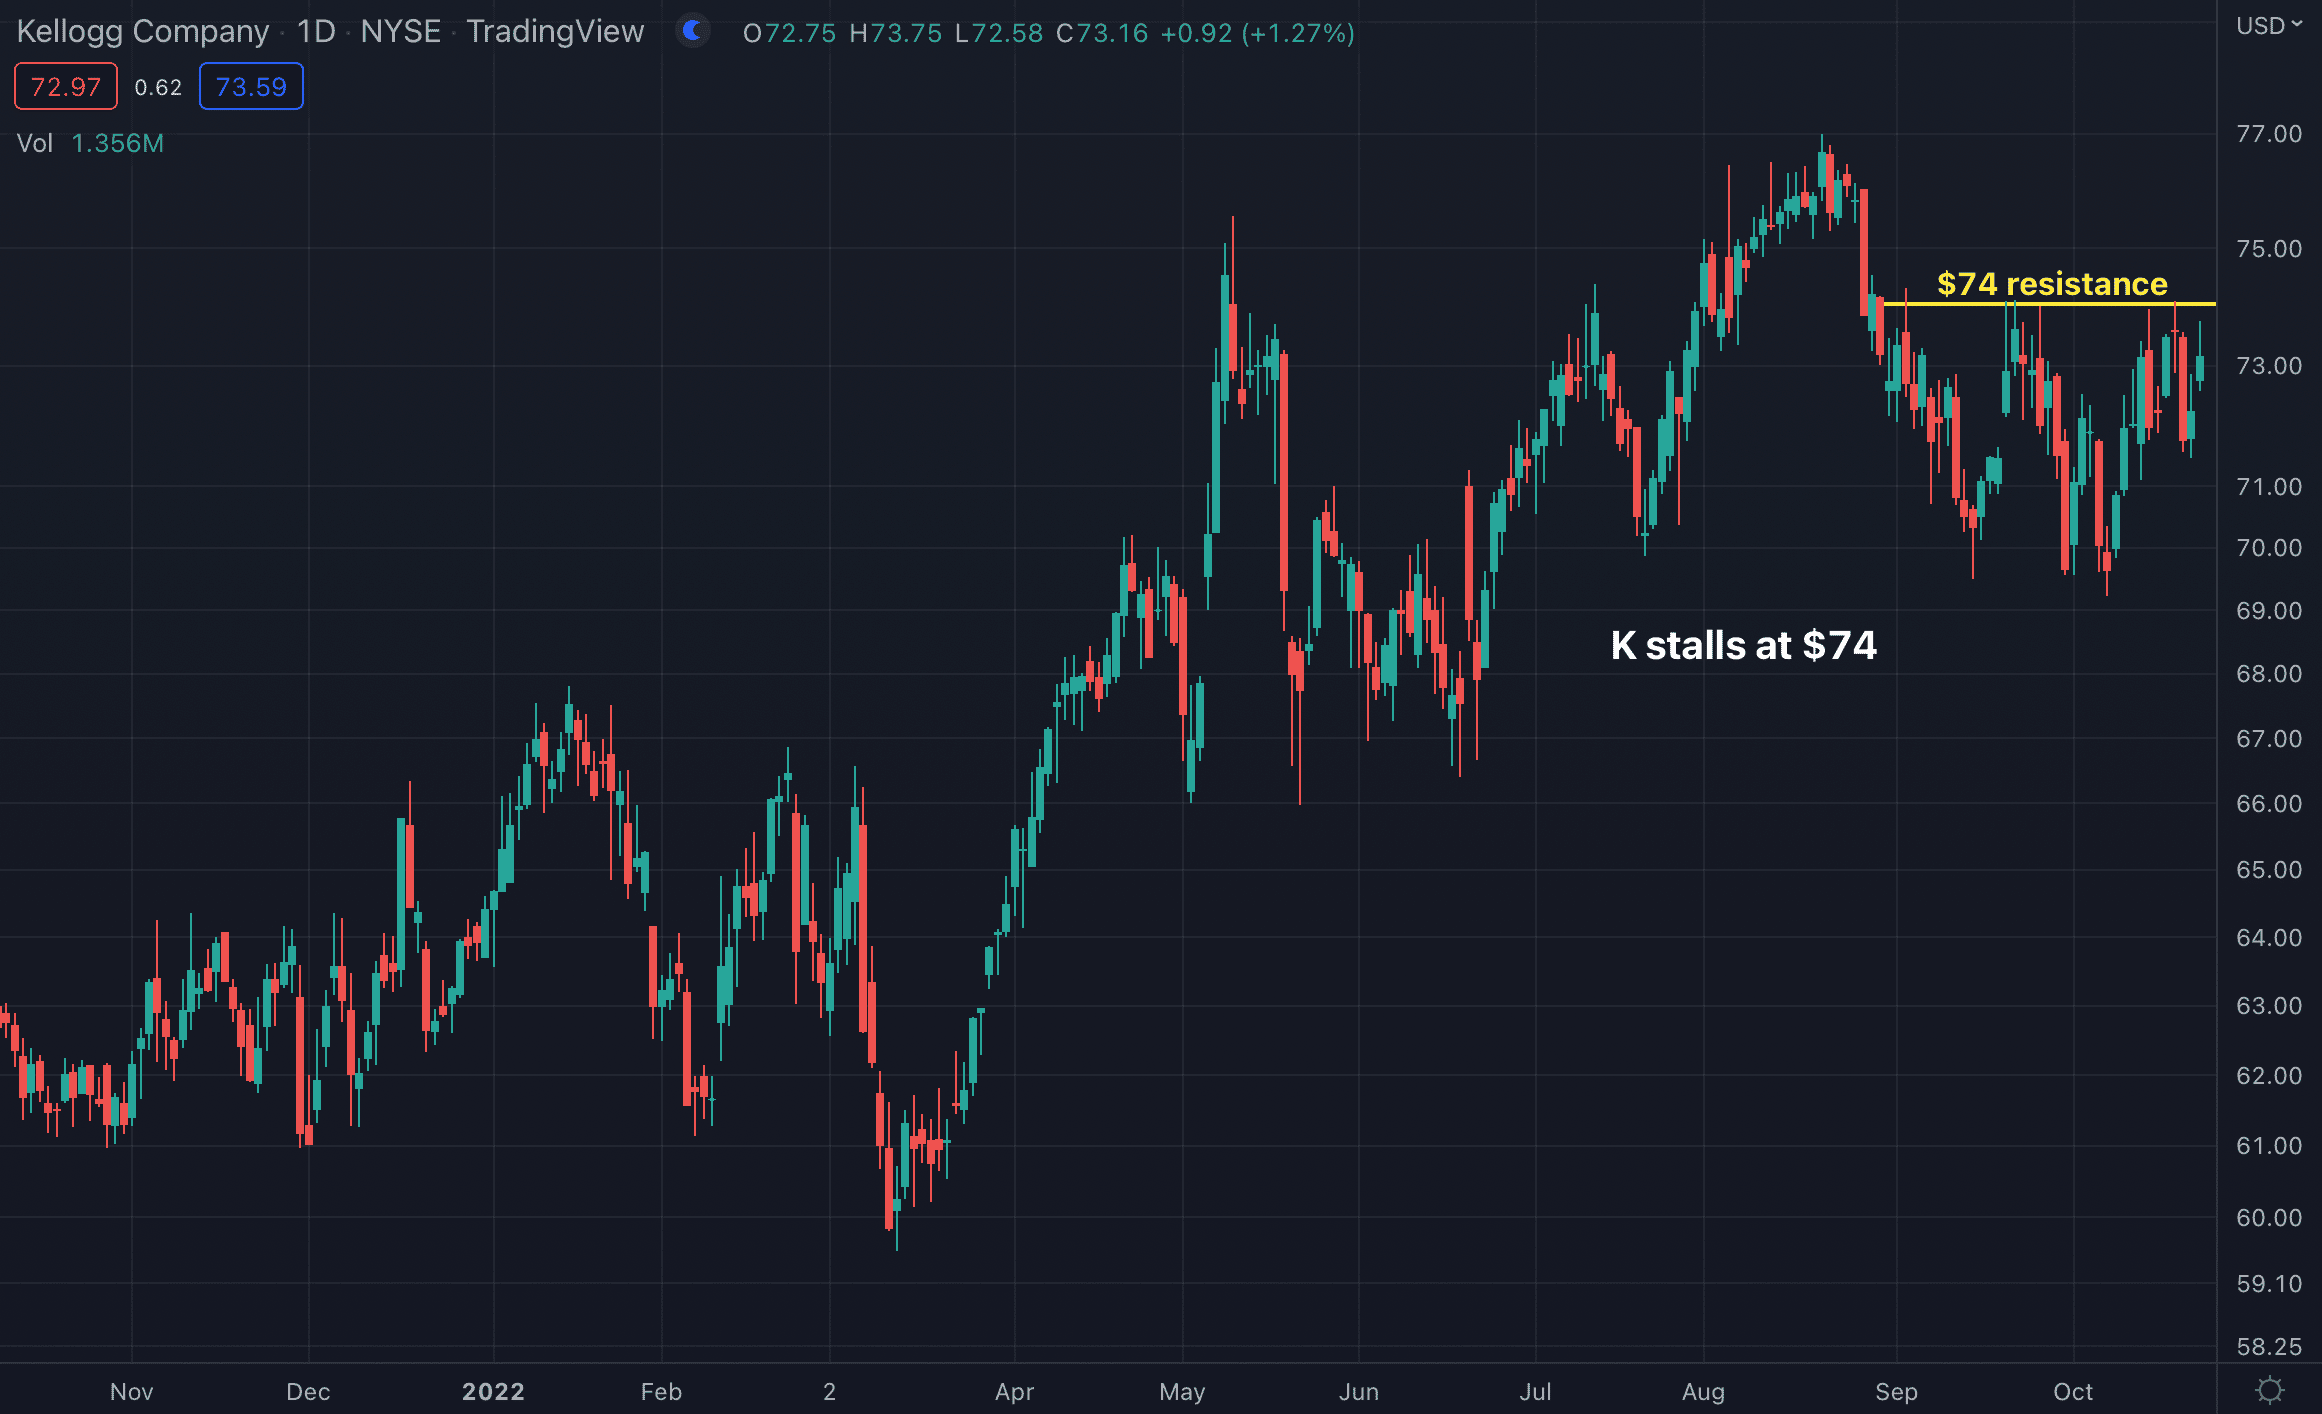
K has hit the $74 level as resistance (yellow) on multiple occasions since September. After pulling lower from the most recent test of $74, the stock appears to be trying to head back up there. A break above $74 would open the door to higher prices, possibly testing the stock’s 52-week high.
The Tale of the Tape: K has an important resistance at $74. A long trade could be entered on a break through $74, with a stop placed below it. However, if you are bearish on the stock, a short trade could be made on any rallies up to the $74 area.
Before making any trading decision, decide which side of the trade you believe gives you the highest probability of success. Do you prefer the short side of the market, long side, or do you want to be in the market at all? If you haven’t thought about it, review the overall indices themselves. For example, take a look at the S&P 500. Is it trending higher or lower? Has it recently broken through a key resistance or support level? Making these decisions ahead of time will help you decide which side of the trade you believe gives you the best opportunities.
No matter what your strategy or when you decide to enter, always remember to use protective stops and you’ll be around for the next trade. Capital preservation is always key…
Good luck!
Christian Tharp, CMT