
Market Update: What To Look For Going Forward
Share

The S&P 500 and Nasdaq Composite both extended their gains last week, increasing by 3.5% and 3.4%. The Nasdaq Composite has now seen a golden cross (50-day up through 200-day moving average), which is widely regarded as a bullish sign. That said, the next major hurdle will be getting back above the 20-month moving average (teal line) for two consecutive closes, which would significantly increase the probability of this cyclical bear market being over and transitioning into a new bull market.
It’s important to note the on average, cyclical bull markets are at least two years in length and typically enjoy minimum 50% gains (3500 x 1.5 = 5250 on the S&P 500).
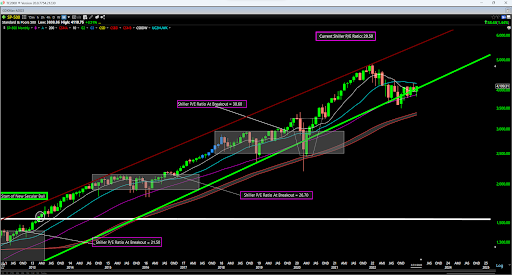
(Source: TC2000.com)
As discussed in previous updates, we saw a rare breadth thrust trigger on January 12 that occurs when the advancers/decliners ratio (summed 10-day average of NYSE advancers/decliners) goes above 1.98. A move like this one requires extreme buying pressure to occur, which is what makes the signal so bullish.
This signal has a strong track record with positive returns 88% of the time over the next 12 months. Hence, the odds are strongly in favor of the bulls over the next 3-9 months, potentially setting up rally back to the 4400-4600 level even if this signal were to underperform the average. Past returns and drawdowns are shown below:
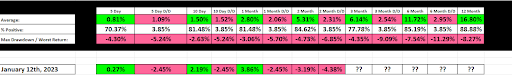
(Source: Market Data, Author’s Table)
Up until last week, the performance of this signal was diverging somewhat from the historical averages, with the S&P 500 down 3.19% on a 2-month return basis, a clear underperformance vs. an average 5.31% gain in the past 27 signals.
However, we have since seen it move back in line with its average, with returns for the 2-month marking the exact low for the S&P 500 during its recent correction. This is a positive sign given that when a current signal diverges massively from the historical averages, this can be a reason to begin to second guess the validity of the signal, especially when returns have been so robust and positive with few outliers over the past 70 years.
Valuation & Sentiment
Moving over to valuation and sentiment, the S&P 500 continues to trade above its long-term moving average in regards to the Shiller PE ratio, with the current Shiller PE ratio sitting at 29.8 vs. a long-term average of 28.0.
The good news is that this is a significant improvement from a reading of 40.0 in January 2022 and we are no longer in nosebleed territory. The bad news is that during periods of higher rates or elevated inflation, the Shiller PE ratio typically bottoms below 22.0, and we didn’t come remotely close to this level even at the lows of 3500 for the S&P 500.
That said, valuation is not a great short-term timing indicator, but rather, it simply gives us an idea of how far a market can go in a given direction. So while this indicator remains on a neutral reading with valuations unsupportive of higher prices, this doesn’t mean one can’t maintain significant long exposure, especially if one is building a portfolio around high-quality names trading at discounts, such as our past picks Capri Holdings (CPRI), Restaurant Brands International (QSR), MarineMax (HZO), Restoration Hardware (RH), and i-80 Gold (IAUX).
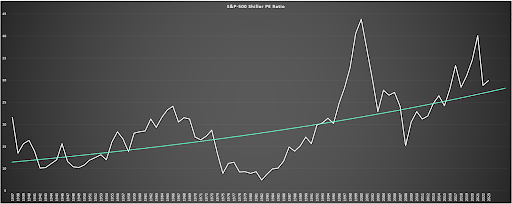
(Source: Multpl.com, Author’s Chart)
From a sentiment perspective, we haven’t seen any sign of complacency over the several months and we actually saw a meaningful increase in negative sentiment during mid-March amid worries of bank crisis. Sentiment is a much better predictor of future returns and as is shown below, sentiment continues to be supportive of higher prices in the market given that there’s a complete absence of real optimism out there.
So, while sentiment indicators may not be on contrarian bullish readings after last week’s rally, they are nowhere near what I would consider to be sell signals and suggest that the path of least resistance for the market is higher and that any 8% plus pullbacks in the S&P 500 have a high probability of being bought.
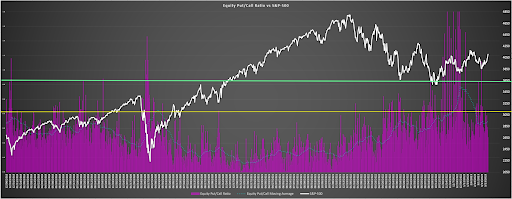
(Source: CBOE Data, Author’s Chart)
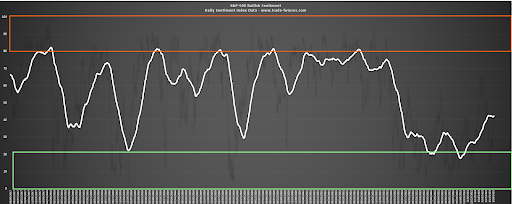
(Source: Daily Sentiment Index Data, Author’s Chart)
Heading into the week, the S&P 500 is well above the midpoint of its strong support/resistance range (3500 vs. 4315) at 4110. It is also back above the midpoint of its range using short-term support at 3765 – 4315 resistance, resulting in a less favorable reward/risk setup for the market short term. That said, there’s no major resistance for the market until the 4190-4300 region, so this rally could extend further. Given the breadth thrust signal and the fact that the market is rallying in the face of bad news, I continue to see this as a buy-the-dip market, and I would not hesitate to increase my position in the S&P 500 ETF (SPY) if we head back below the 3800 level.