
This Week’s Stock Pick Could Climb 61% Despite Market Conditions
Share
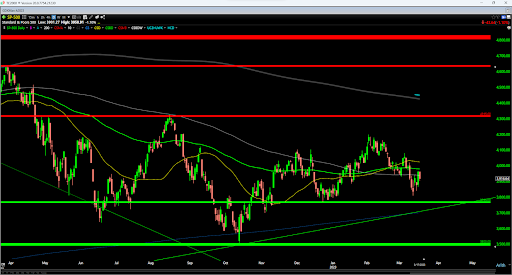
The S&P 500 and Nasdaq Composite rebounded last week, up 1.4% and 4.4%. Despite the recent pullback, the 50-day moving average still has a positive slope and is still well above the 200-day moving average on the S&P 500, a silver lining. While this doesn’t mean we’re out of the woods yet, minimal technical damage has been done despite the recent correction. The bulls have played defense where they need to for now near upper support at 3765.
As long as this support level continues to be defended on a weekly closing basis, there’s no reason to believe we are heading down to retest the 3500 level on the S&P 500, where the index bottomed in October of last year.
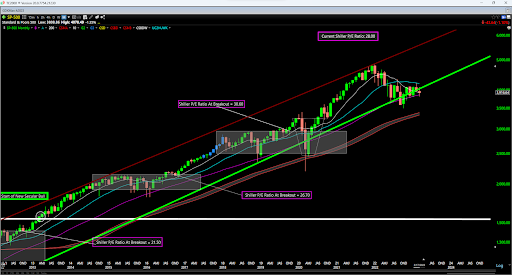
(Source: TC2000.com)
As highlighted in previous updates, the short-term picture improved slightly with a golden cross in February (50-day up through the 200-day moving average following 15% plus correction), but this recent strength has not yet translated to an improvement in the bigger picture as both indexes remain below their 20-month moving averages.
The first confirmatory sign of this breadth thrust would be a monthly close back above the 20-month moving average for the S&P 500 (4200), pushing the S&P 500 back onto a bullish reading.
While some investors have understandably turned bearish after the failure of two major banks (Silicon Valley Bank and Signature Bank New York, as well of fears of additional bank runs, it is important to remember that while the fundamentals are important, we did see a very rare breadth thrust on January 12, which takes extreme buying pressure to occur. This signal has a strong track record with positive returns 88% of the time over the next 12 months, a 16% average 12-month forward return, and no undercuts of a previous major low (3500 in this case) over the next 6 months.
Obviously, the seemingly deteriorating fundamentals could lead to a failure in this signal, but I will gladly bet on a signal with a ~90% track record over the fundamentals. I believe some of this has already been discounted into the market.
![]()
(Source: Market Data, Author’s Table)
Meanwhile, we received yet another signal in the week before last, which has bullish implications. This occurred when we saw the first 90% downside volume day (NYSE volume in a single day shows over 90% of volume being declining vs. advancing) and when this occurs shortly after a breadth thrust, the forward returns have been quite bullish.
In fact, the average 3-month forward return is 7.68% and the average 6-month return is 11.11%, as well as an average forward 6-month drawdown of 2.60%. Currently, we’ve already seen an average drawdown of 2.80%, and the market is higher 92.9% of the time, suggesting that any retest of the lows on the S&P 500 should provide an excellent buying opportunity, with a floor for the market likely to come in in the 3750-3800 region if we do see further weakness.
Overall, this confluence of signals is quite bullish. While there’s absolutely reason to be cautious and hold a little extra cash given the unusual circumstances with fears of bank failures, I prefer to side with the technicals when we have very rare bullish events occurring that suggest potential selling exhaustion.
The other point worth noting is that the reaction to the news matters more than the news itself, and with the S&P 500 and Nasdaq Composite actually up last week, there appears to be some buyers stepping in and looking at value vs. worrying about the scary fundamentals – a positive sign.
Valuation & Sentiment
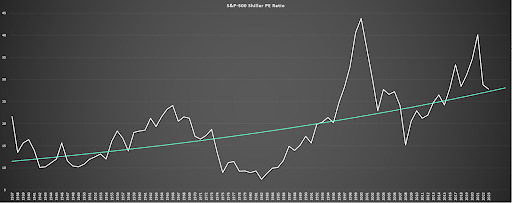
Looking at valuations, we are still yet to head into a low-risk buy zone, however, we are getting closer to one, with the Shiller PE Ratio sitting at 28.0 heading into the week. Although this is still above the long-term moving average (as shown below), this is a major improvement and the lack of progress in the market combined with growing earnings for the S&P 500 is allowing valuations to finally start to play catch up to what was a very expensive market previously. Ideally, I would prefer to see the S&P 500 decline below 25x earnings from a Shiller PE standpoint, but we are finally getting closer to a value zone where it makes sense to put some capital to work.
With regard to overall sentiment, the equity put/call ratio shown below (pink bars) has seen a major pullback in readings over the past month vs. very elevated put/call readings in December and January.
The increase in the put/call ratio is a positive sign, suggesting that we are seeing some fear trickle back into the market, which can help the market to hammer out short-term or medium-term lows.
For now, this indicator still remains on a neutral reading, but the pick up in negative sentiment is positive from a contrarian perspective. Assuming these market declines were to continue or that market participants remain bearish on balance, we could see this indicator head back to a contrarian bullish reading by month-end, as it did briefly in January which helped to put in a market bottom.
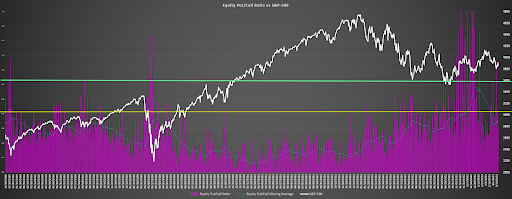
(Source: CBOE Data, Author’s Chart)
What’s The Action Plan?
Heading into the week, the S&P 500 remains near the midpoint of its support/resistance range (3500-4315) at a current price of 3920. Normally, this would suggest a balanced reward/risk, but as highlighted previously, the floor for the market from now until August is likely to come in between 3700-3800 based on the two bullish signals that have fired. This suggests that the real range could be 3700-4315, placing the S&P 500 in the lower end of this range.
Given this setup, I remain roughly 70% invested and would not hesitate to add to my position in the S&P 500 if we see a pullback below 3770 toward support. For now, I continue to hold cash in case this pullback deepens, and continue to believe that a focus on mid-cap and large-cap names makes the most sense as well as a focus on high-quality businesses, given the very volatile environment.
Which brings us to our stock pick of the week…
(Source: TC2000.com)
Capri Holdings: One Retailer Proving To Be Recession-Resistant
Capri Holdings (CPRI) is a ~$5.3 billion company in the Luxury Retail industry with three iconic brands: Versace, Jimmy Choo, and Michael Kors.
The new name for the company (previously Michael Kors Holdings with ticker KORS) was adopted followed the closing of its acquisition of Versace (2018), and the company has steadily increased earnings and sales since 2019, with annual EPS improving from $4.97 to $6.21 and revenue up to $5.65 billion despite having to wade through a global pandemic and headwinds in China which is one of its major markets due to COVID-19 related lockdowns.

(Source: Company Presentation)
Capri Holdings generates sales from its operated stores in the United States, Canada, Latin America, Europe, Middle East, Africa, and Asia, as well as e-commerce sites. Following the completion of its Capri Retail Store Optimization Program at the end of FY2022, the company closed a total of 167 underperforming stores, leaving it with a total of 1,294 stores globally made up of full priced and outlet, and another 4145 doors in terms of wholesale.
The company’s mix is skewed towards Asia where it has 576 stores (44% of stores), followed by the Americas and EMEA. In regards to its largest brand, this continues to be Michael Kors, with the company operating 827 retail stores, down slightly from 834 in the year-ago period.
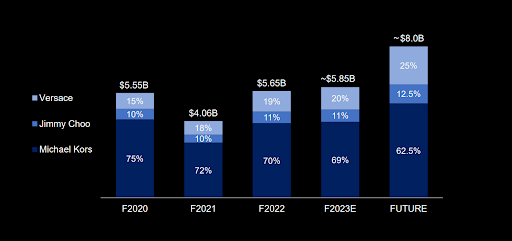
(Source: Company Presentation)
In regards to the company’s long-term vision, Capri Holdings is confident that it can grow its three brands to $8.0+ billion in annual revenue long-term, with a high confidence that it has untapped potential in its Asia region, driven by further growth in its retail sales. Capri Holdings expects to achieve this by growing its retail store base to 1,400+ stores (10%+ growth), with a focus on increasing its retail footprint for Versace by up to 40% while continuing to right-size its Michael Kors footprint, with this initiative nearly complete.
When it comes to strategies to increase revenue overall, Capri Holdings is looking to grow its second-largest segment, Versace, with an aim to grow to 20+ million customers. Since 2018, the company has done an incredible job growing at a better than 25% CAGR, but through better use of data analytics, it hopes to accelerate this growth rate. Plus, Capri Holdings believes that it hasn’t even scratched the surface for the potential of its accessories business within Versace, with an aim to grow accessories sales to $1.0 billion from just $200 million currently.
It also sees the potential to increase footwear revenue to $300 million per annum at Versace. So, while it may have seemed like Capri Holdings was overpaying for Versace in 2018 for $1.12 billion or more than 1x sales, this is because this is a business that could easily grow to $2.0+ billion, if the company successfully taps into new areas of growth.
Meanwhile, Jimmy Choo is in a similar position, with the lowest revenue of the three segments and a relatively small customer base. Although the opportunity isn’t as large, Capri Holdings believes it can more than double the customer base to 10 million and lean into Gen-Z and young millennials through collaborations and digital innovation. This demographic is massively under-represented within Jimmy Choo and it’s a huge growth opportunity in both China and Japan.
Plus, like its strategy for Versace, Jimmy Choo sees the potential to nearly triple its accessories business to $300 million and expand accessories to 30% of its mix to drive higher margins. Assuming Capri Holdings is successful with expansions at these two brands, I believe the $8.0 billion per annum revenue goal figure company-wide is a conservative one.
Recent Results & Earnings Trend
Just last month, Capri Holdings released its fiscal Q3 2023 results, which showed revenue declined 6% year-over-year to $1.51 billion, an ugly headline for investors that were looking for growth on a year-over-year basis given the guidance provided earlier in the year.
That said, revenue was more or less flat on a constant currency basis (down just 0.5%) and retail sales on a constant currency basis were actually up year-over-year, an impressive feat given the sharp pullback in consumer demand we’ve seen for many other retail/apparel brands. Plus, from a big picture perspective, Capri Holdings grew its customer base by an incredible 20%, suggesting it is clearly making progress when it comes to delivering on key metrics for ultimately realizing its long-term goals.
While investors that dug into the results might have been able to look past the weaker revenue figures, the 17% decline in quarterly earnings per share [EPS] of $1.84 was well below estimates, which has set Capri Holdings up to earn barely $6.00 this year.
Not only is this a 2% decline on a year-over-year basis assuming annual EPS comes in near estimates, but it’s more than 7% below the guidance provided at the beginning of the year when management was clearly too optimistic about how calendar year 2022 (FY2023) would play out. The main reason for the softness was operating margins that were well below estimates at Michael Kors (22.9% vs. goal of 24.0%), resulting in Capri Holdings slashing its FY2023 guidance in the eleventh hour which certainly didn’t please investors.
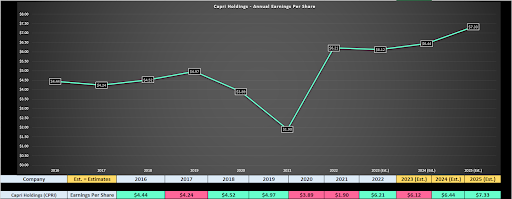
(Source: YCharts.com, Author’s Chart, FactSet Estimates)
Not surprisingly, the stock fell 23% on the day following its earnings results given that it was priced for a beat and the company instead delivered a miss and a guidance cut. However, looking ahead to FY2024 and FY2025, we can see that annual EPS is expected to rebound and hit new all-time highs. This is despite what’s still a challenging economic environment, suggesting that the FY2024 and FY2025 results don’t come near highlighting the true potential of these brands.
That said, if one does want to invest in the retail space, luxury retailers are one way to play it, given that while they may be seeing some headwinds from the tougher economic environment, they aren’t seeing nearly the headwinds of most retailers where their average consumer is much less affluent.
Let’s dig into Capri’s valuation to see whether investors are getting a solid price for what’s set to be several years of growth ahead.
Valuation
As shown in the chart below, Michael Kors (now Capri Holdings) has traded at an average earnings multiple of 17 since going public, and closer to 12.5x earnings (4-year average) since its acquisition of Versace in December 2018.
Following the recent decline in the stock, Capri Holdings has found itself trading at its lowest earnings multiple (~6.6x forward earnings) since March 2020 and September 2022, which both marked major lows for the stock. In fact, on a forward 9-month basis from periods when CPRI fell below 6.0x forward earnings (March 28th, 2020 and September 23rd, 2022), the stock has enjoyed an average draw-up of 63.4%, an incredible return for investors willing to be contrarians during violent corrections.
Typically, single-digit earnings multiples are reserved for businesses in secular decline or with anemic margins, and with earnings estimates pointing higher and ~65% gross margins, this is clearly not the case for Capri Holdings.
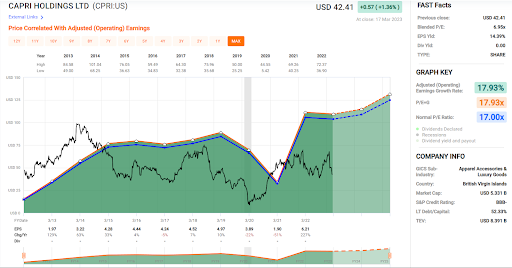
(Source: FASTGraphs.com)
While some might assume that a fair value for Capri Holdings is 12-17x earnings given that this is where the stock has traded since it went public and since it acquired Versace and changed its name to Capri Holdings, I prefer to be conservative when trying to figure out fair value.
However, even if we use what I believe to be a fair multiple of 10.6x earnings (a 15% discount to the stock’s 4-year average PE ratio) to account for the multiple compression we’ve seen in several sectors and using FY2024 earnings estimates of $6.44, I see a fair value for Capri Holdings of $68.25 per share. This translates to a 61% upside from current levels, representing a very attractive return for investors stepping in to buy the stock after this correction.
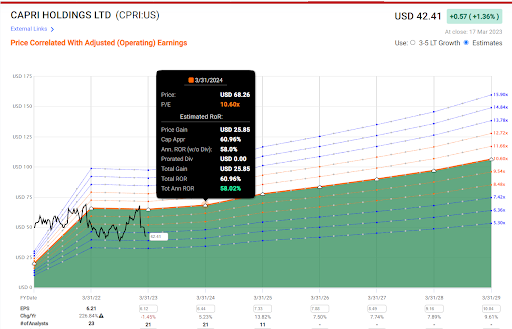
(Source: FASTGraphs.com)
If we take a longer-term view and look at what the potential is for investors willing to hold the stock for a few years, the upside potential is significant. As shown above and using conservative annual EPS estimates that assume the company meets its 2022 Investor Day targets, we can see that Capri Holdings should report annual EPS of $8.49 in FY2027.
Even if we use a multiple of 13.0x earnings which is below its long-term average (17.0x), this would translate to a fair value for the stock of $110.35. Assuming the stock were to trade in line with its price target, Capri Holdings would nearly triple from current levels, suggesting it’s one of the most undervalued names in the market today. This is especially true given that I erred on the side of caution and used very conservative earnings estimates post FY2025.
Summary
It’s easy to be pessimistic and think that something is fundamentally wrong with Capri Holdings following a 42% share price decline in just 28 trading days, however, we have seen this movie before several times. In fact, the stock has regularly suffered 30-45% declines in less than 50 trading days over the past several years given that it is a high beta name in a sector that tends to move like a school of fish when it’s out of favor.
In the case of the recent decline, it was primarily due to the significant miss on guidance on top of already mediocre Q3 results and the mean reversion in the overall market due to fears of further bank runs, which resulted in another leg down for beaten up stocks where sentiment was already in the gutter.
When it comes to companies with iconic brands in their portfolio, investors must be careful not to miss the forest for the trees. Capri Holdings certainly meets this criterion with three luxury brands that continue to grow market share globally. Looking at it from a big-picture standpoint, while FY2023 annual EPS will miss guidance by a mile, this is an aberration in the long-term trend with annual EPS set to hit new all-time highs in FY2024.
So, for investors willing to stomach a little short-term volatility and buy when blood is in the streets, I am hard pressed to find a better value out there than CPRI at ~6.6x FY2024 earnings estimates.
This is the kind of exciting investing ideas and analysis you could be receiving every week when you join my Eagle Vision service. We’ll go over a new stock with actionable insights to get you off the sidelines and into the action.
The timing couldn’t be better, right now we are offering this service for just $1 to join for your first month!
PLUS as a BONUS for checking out everything we have to offer in Eagle Vision, you can get started trading with Wealthpop’s “Top Stocks of 2023” – absolutely free.